
Having an accurate balance sheet is essential not just for wise financial management, but also because it’s required by law in Singapore.
This means the Australian Securities and Investments Commission (ASIC) requires all companies to present annual financial statements, including balance sheets, to ensure transparency and maintain good financial standing.
Failing to meet these requirements carries hefty penalties, as illustrated by ACRA’s penalty structure.
According to a statement we received from ACRA, a company that fails to submit its financial statements on time can be penalized; late fees start at $300 for submissions within 3 months of the due date, rising to $600 for those submitted after 3 months.
In addition to legal obligations, there’s been considerable talk about the possibility of a ‘balance sheet recession,’ as identified by a recent study we found from Fidelity International. This concept highlights that global debt reduction initiatives could significantly impact economic growth.
For businesses in Singapore, this adds an extra layer of urgency to ensure their balance sheets are robust and effectively managed.
Accurate balance sheets are not just an internal guide to your financial health; they’re also crucial tools for successfully navigating any impending economic downturns.
It is vital for your business to know how to prepare accurate balance sheets for compliance reasons and to prevent yourself from incurring such penalties.
So, this article will explain why balance sheets are important, define balance sheets, outline the repercussions of failing to comply, and discuss the benefits of using tools such as accounting software to assist with keeping your financial data in check.
- A balance sheet is a key financial statement that details a company’s assets, liabilities, and equity, helping businesses assess their financial health and stability.
- Bankers analyze the balance sheet by using 3 ratios, which are the debt-to-equity ratio, debt-to-total assets ratio, and current ratio.
- Limitations of the balance sheet include its snapshot nature, reliance on historical cost, and inability to capture intangible assets or cash flow dynamics, requiring complementary data.
- ScaleOcean accounting software is an all-in-one solution that automates balance sheet creation, integrates real-time data, and provides AI-powered insights for better financial decision-making.
What Is A Balance Sheet?
The balance sheet is a snapshot of a company’s financial position at a given time, outlining its assets, liabilities, and owner’s equity. It helps businesses and their investors evaluate the way in which a company is funded by debt, equity, or a combination of the two.
A balance sheet can offer an insight into more than just numbers, as the format is used to convey how a business is managing its resources. Unlike other reports which cover a period of time, a balance sheet provides a view of a business’s financial position right now.
Components of A Balance Sheet
A balance sheet consists of three main parts: assets, liabilities, and equity, with the equation always being Assets = Liabilities + Equity. It is through this equation that we can understand the financial position of a business. Each section has its role in displaying the overall health of a company:
Assets
Assets are what a company owns and include any resources that hold value and help operate a business.
These can be current assets (which are short-term and used within one year or are expected to be converted into cash), or non-current assets (such as equipment and property that is owned and held over a longer period and contribute to the business in the long term).
These are accurately accounted for through the concept of double-entry accounting.
Liabilities
Liabilities represent a company’s debts to third parties, which may include suppliers, lenders, or employees.
There are two categories of liabilities: Current liabilities include debts due within a year, like accounts payable, short-term loans, or unpaid salaries, and are often recorded using accrual accounting to match expenses with the correct period.
Non-current liabilities (longer-term financial commitments such as bonds payable or mortgages). This section shows how reliant a company is on external finance.
Equity
Equity represents the owners’ stake in a company after all its liabilities are subtracted from its assets. It includes items such as common stock, additional paid-in capital, and retained earnings.
The figure for equity is what will be left for shareholders if the company’s assets were to be liquidated and its liabilities paid off.
The value of a business is its salvage value in the case of a balance sheet calculation, and this should also consider the profit and loss (P&L) statement, which shows how the equity position of the company can be built.
Equity increases as profits are generated by the business and retained by the owners, so a business can use equity as an indication of how it can survive tougher economic times.
Why is a Balance Sheet so Important?
 The balance sheet is vital as it demonstrates a company’s financial position-its assets, liabilities, and equity-which allows investors and lenders to understand its stability, risk, and ability to grow or withstand challenges.
Here are the key ratios that emphasize why the balance sheet is so important:
- Leverage Ratios: These assess the level of a company’s debt relative to its equity. A high debt-to-equity ratio indicates a higher level of financial risk to the lenders and investors.
- Liquidity Ratios: These show a company’s ability to meet its short-term obligations using its current assets. It allows lenders and investors to be confident in a business’s ability to manage immediate cash flow requirements.
- Rates of Return Ratios: These demonstrate the profitability of a business by calculating a return on an investment made by stakeholders. They allow lenders and investors to determine if their invested cash is generating a healthy return.
- Efficiency Ratios: These calculate how effectively a business is utilizing its assets to produce sales, and allow lenders and investors to see where the business is operating efficiently and what could be improved.
How The Balance Sheet Works
The balance sheet gives an in-depth perspective of the overall financial position of a company by clearly presenting its assets, liabilities, and owner’s equity, and is the tool by which investors and creditors can better analyze the business’s financial health at a particular point in time.
The formula that underpins every balance sheet is as follows:
Assets = Liabilities + Equity
This basic accounting equation asserts that the total value of assets held by a business must be financed by either liabilities or owner’s equity, hence the equality between the two.
For example, if a business has $300,000 in assets and $150,000 in liabilities, then its owner’s equity will be $150,000, showing that after all debts have been settled, $150,000 of the assets remain for the owner.
This will all be accurately recorded through the general ledger. Understanding this formula allows business owners to properly gauge the business’s leverage, stability, and also to make better decisions between the owners and lenders.
Balance Sheet Example
Below is an example of a balance sheet for a company on December 31, 2024. This document provides a snapshot of the company’s assets, liabilities, and equity to help understand the firm’s financial reporting, financial condition, and stability.
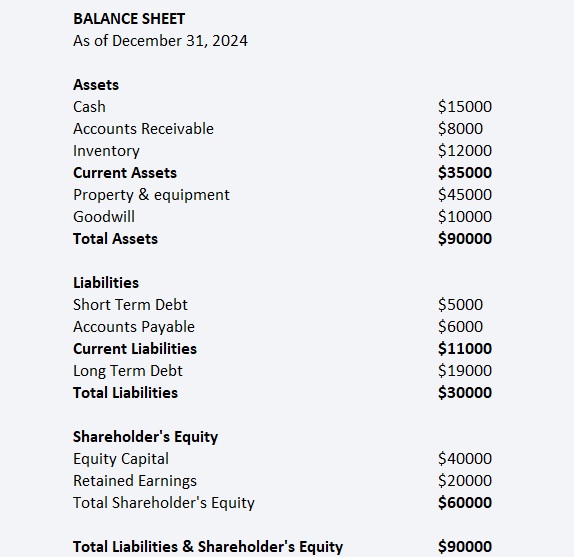
This example of a balance sheet clearly shows the company’s financial position as of December 31, 2024. The business owns assets worth $90,000 in total, and current assets amount to $35,000 in total.
Current assets can be converted into cash easily in order to operate the business daily and cover liabilities of short-term duration.
Businesses should be aware of the procedures for how these numbers are recorded; understanding the process of bookkeeping and accounting is critical as it allows a business to keep its records accurate.
The $45,000 allocated to property and equipment depicts assets owned by the company which would support its day-to-day operation.
Liabilities stand at $30,000 in total for the business, and current liabilities have a figure of $11,000, indicating that cash flow needs to be sufficient enough to cover short-term debts.
The $60,000 value of shareholders’ equity clearly illustrates that the company is stable and possesses sufficient capital to potentially increase investment or grow business size and withstand short-term economic setbacks.
As it stands, the balance sheet illustrated displays that the business has enough capital to service immediate debts and a solid platform upon which further investments or growth can take place.
How Does a Banker Analyze The Balance Sheet?
Bankers analyze balance sheets of companies by evaluating various key financial ratios that assist them in evaluating the financial condition and risks faced by the company.
These financial ratios help a banker understand a company’s debt management, liquidity, and the company’s solvency. The key financial ratios considered are:
Debt-to-Equity Ratio
The D/E ratio is used to evaluate the financial leverage of a business and determines the level of risk faced by a bank, as it measures the amount of debt relative to its equity. The D/E ratio can be calculated using the formula:
Debt-to-equity ratio = Total liabilities ÷ Equity
For example, if the company owes its lenders $100,000 and has equity of $200,000, the D/E ratio is 0.5 (i.e., $100,000/$200,000). This indicates that the business has liabilities equal to 50 cents of each dollar it has as equity, indicating a low amount of financial leverage.
The greater the D/E ratio, the greater the dependency of the company on its lenders, which subsequently raises the risk for bankers assessing its viability.
A low ratio indicates that the business is financially sound, as the ratio shows conservative reliance on its financing, and a low risk for a lender.
Debt-to-Total Assets Ratio
The debt-to-total assets ratio indicates how much of its assets are financed by debt. High values of this ratio show that the business relies significantly on external finance, which increases the difficulty for businesses during cash flow problems. It is calculated using the formula:
Debt-to-total assets ratio = Total liabilities ÷ Total assets
For example, if the total assets are $500,000, while the liabilities figure stands at $200,000, the debt-to-total assets ratio will be 0.4 ($200,000/$500,000). This reveals that 40% of its assets are funded through borrowings.
Bankers can analyze this ratio in terms of the solvency of the business, in how easily it can meet its liabilities using the assets at hand.
A low ratio is indicative of less risk on behalf of a banker lending to the business, as the firm has a larger amount of equity for cushion, should the worst come to worst.
Current Ratio
The current ratio measures a company’s ability to service its current debts by comparing its current assets to its current liabilities.
Bankers are keen to understand whether the business will be able to discharge its obligations by utilizing its short-term assets in order to meet day-to-day needs. The current ratio is calculated using the formula:
Current ratio = Current assets ÷ Current liabilities
If, for instance, the company has $120,000 in current assets and $80,000 in current liabilities, then the current ratio is 1.5 ($120,000/$80,000). This indicates that the company is able to pay off $1.50 worth of debts for every $1 owed in short-term debts.
Anything more than 1 would indicate that a business has enough current assets to cover its liabilities; however, a ratio that is far in excess indicates the business may be making inefficient use of its current assets; bankers prefer to see the current ratio hovering somewhere near 1 to 2.
Usage of the Balance Sheet in Financial Modeling

The balance sheet is vital in financial modeling as it offers accurate insight into the company’s financial condition and will help when trying to make accurate forecasts, as you can use information such as current working capital, total fixed assets, and shareholders’ equity.
It would be impossible to create models that help predict how a business might look in the future, as well as help make a decision in terms of growth and investment, if not supported by accurate balance sheet figures.
The models created can be adjusted when the business needs to expand its premises and employee capacity, as this is expected to have a positive impact on financial ratios.
For example, an increase in inventory or staffing is expected to cause a change in all cash flows as well as funding needs and current working capital.
These figures will assist you when creating models that enable you to determine and plan the increase of funds necessary for growing and investing in your business.
The balance sheet is useful for evaluating financial ratios such as financial leverage, debt-to-equity, return on assets, and current ratio. These ratios help you to determine the efficiency of your business, as well as its solvency in relation to others in the market.
Limitations of the Balance Sheet
Like every financial report, the company needs to be aware of the limitations associated with the balance sheet. Being able to identify the limitations of this statement is beneficial as it enables you to know which figures need to be accompanied by additional financial figures.
This avoids drawing inaccurate conclusions based on incomplete data of a business. Here are some of the main limitations of a balance sheet:
- Snapshot in time: The balance sheet represents financial figures for a single point in time, and does not include ongoing trends and daily operational figures that can be found in other reports like the profit and loss account or the cash flow statement.
- Historical cost basis: The majority of assets shown on the balance sheet are reported on the historical cost basis, meaning that they have not been updated to present market values and will potentially be showing the business at a much lower valuation than it would be perceived on the open market.
- Exclusion of intangible items: Intangible factors of a business such as its customer goodwill, employee experience, or its brand are not accounted for in the balance sheet. It can be argued that these figures should be accounted for due to the value they represent to a business in terms of their long-term survival and success.
- Estimates and judgments required: Many values on the balance sheet, such as figures relating to depreciation, debt collection issues, or inventory valuation methods, are only estimates and therefore subject to error. These estimates may vary depending on management discretion, which may in turn result in varying accuracy figures on a business’s balance sheet.
- Potential liquidity misrepresentation: Certain current assets may not be able to be sold at their stated worth in an emergency, for example, depending on how easily the assets can be traded. This may mean that current assets’ value stated above may not reflect the true liquidity position of the business at a specific point in time.
- Limited cash flow dynamics: An entity’s balance sheet gives a clear insight into the amounts of what it owes and what it has within the company; however, it does not indicate how cash is actually flowing into and out of the company. A business’s cash flow statement example would provide this detailed information, although for purposes of displaying the cash figures, there may be other additional forms a business may take when dealing with cash flow.
Common Mistakes When Making Balance Sheets
While creating a balance sheet might seem straightforward enough, quite a number of companies make preventable mistakes in the process.
Although often accidental, these mistakes can lead to financial insights that are skewed and, consequently, flawed business decisions. Here are some of the most common errors:
Misclassifying Assets and Liabilities
This is a very common error where the items are wrongly placed under different categories. Such as reporting the long-term debt as a current liability, or taking a long-term asset as a current asset, etc.
This misclassification could throw off your financial ratios and cause wrong assumptions about your liquidity and solvency, and how far does it bring an impact on both internal business plans and the external financial reports for business owners.
Failing to Update Balances Regularly
Out-of-date data or information, especially for receivables, payables, or inventory, might make the balance sheet a misrepresentation of the current financial status of the business owners. Regular updates for accounting records are imperative in enabling appropriate business decisions.
When using accounting software, these updates will be automated, hence making your financial data accurate and up-to-date; it provides business owners with more benefits.
Ignoring Depreciation and Asset Valuation
Forgetting to record the depreciation of your assets or failing to update their values could result in an inflated asset value.
This gives you and investors alike the impression that the business is much more wealthy than it actually is, hence bringing bad investment and lending decisions. Depreciation doesn’t only affect the accounting but the business reality of it as well, which is its gradual worth reduction.
Overlooking Accruals and Prepayments
Companies often fail to record their outstanding income (accruals) or prepayments made, especially when year-end accounts are being prepared.
Small as these transactions might seem, they can drastically impact your liabilities and assets when correctly reflected in your reports. When it comes to the income statement, it is even more true.
Making proper accounting for accruals and prepayments would make sure that your business accounts are accurate, and it will not give you false reports that make any stakeholder of your business come up with wrong decisions based on incorrect financial data.
Not Balancing the Equation
Every balance sheet should correspond to the fundamental equation of: Assets = Liabilities + Equity. Whenever figures do not match, it either means there is missing information, a miscalculation, or a misclassification on your balance sheet.
Even tiny figures can ruin the entire credibility of the reports and make auditing extremely painful.
Enhancing Balance Sheet Efficiency with ScaleOcean’s Accounting Software
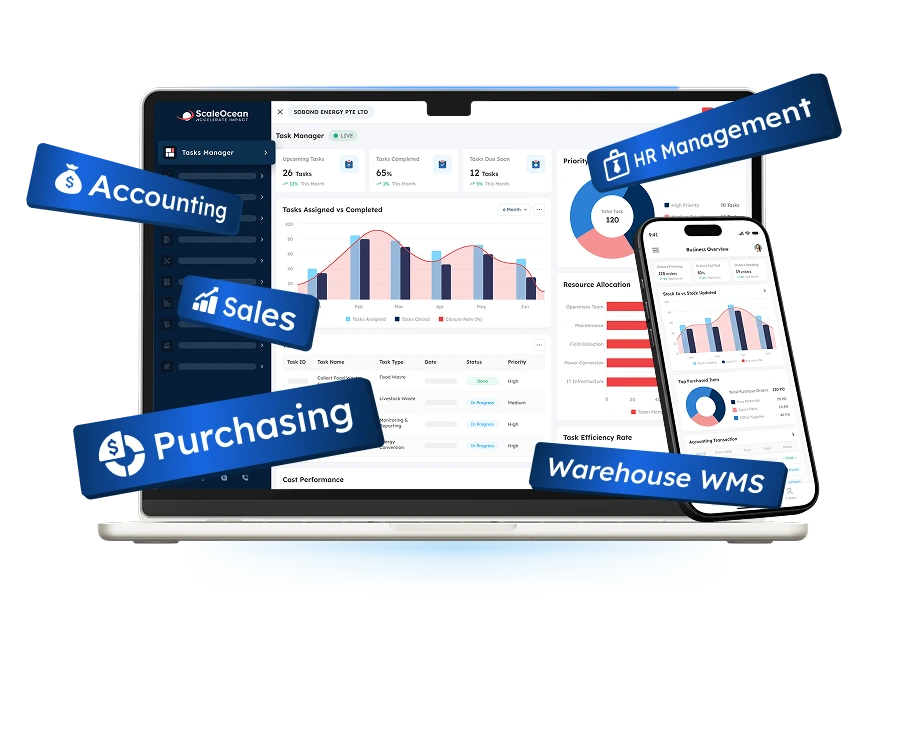
 ScaleOcean’s accounting software is an all-in-one solution designed to make your business’s finances easier. ScaleOcean is designed not only to speed up your accounting process but also to provide you with a comprehensive system to integrate with your entire business smoothly.
Thus giving you accurate, real-time financial information, which helps you to make better informed decisions, improve cash flow, and also increase better financial planning.
ScaleOcean provides a free demo for the accounting software where you can review full of features and also find how it may help your business better financially.
If your business is growing or you simply wish to optimize its operations and management, ScaleOcean gives you access to an excellent array of functions.
A central benefit of using the software is the automatic creation and constant updating of the balance sheet to provide the owner with a clear and up-to-the-minute summary of their assets, liabilities, and equity.
The incorporation of AI adds the ability to analyze financial data for trends, predict future financial outcomes, thereby helping you spot potential problems before they occur, such as growing liabilities or decreasing equity, and recommend potential ways forward.
Key features offered by the ScaleOcean Accounting Software:
- Automated Balance Sheet Generation: ScaleOcean automatically creates and updates your balance sheet in real-time, ensuring accuracy and timeliness.
- Real-Time Data Integration: All your financial data, such as sales, expenses, and assets, is interconnected, offering a unified view of your company’s financial health.
- Customizable Financial Reports: Tailor your balance sheet reports to suit specific needs, including segmenting by department, project, or time period.
- Advanced Financial Analysis: Built-in financial ratios and forecasting tools to analyze liquidity, solvency, and overall financial performance.
- AI-Powered Insights: With integrated AI, the system analyzes financial data to highlight trends, identify risks, and recommend strategies.
Conclusion
A balance sheet is a fundamental statement that highlights a company’s financial position. It showcases its assets, liabilities, and equity, giving you and other stakeholders a snapshot of the business’s stability and efficiency.
However, this statement is only as useful as the information that goes into it and the ability to easily access and interpret it.
With ScaleOcean, your company can not only work better with the balance sheet but can also make informed and concrete decisions that drive the business toward the future.
If you want to make your business financially better and stay on top of the game, start with your free demo of ScaleOcean today!
FAQ:
1. What is another name for the balance sheet?
The balance sheet, also referred to as the Statement of Financial Position, provides a detailed snapshot of an organization’s financial standing by listing its assets, liabilities, and equity at a specific point in time.
2. What are the two types of balance sheets?
The two types of balance sheets are the Interim Balance Sheet, which is prepared during the financial year, usually at the end of a quarter or half-year, and the Liquidation Balance Sheet, which is created when a company is being liquidated to display its remaining assets and liabilities.
3. What are the 7 current assets?
The seven current assets include cash, marketable securities as cash equivalents, accounts receivable representing amounts owed by customers, inventory covering raw materials and unsold goods, prepaid expenses such as insurance advances, and short-term investments.