
A financial metric is a statement of the level of profitability, the efficiency of the use of funds, and the financial soundness of a company. These Key Performance Indicators (KPIs) of Profitability, Liquidity, Solvency, and Efficiency can come as outputs of the financial statements and the supporting documents.
Navigating Singapore’s competitive business environment demands more than just a great concept. Understanding the statistics is critical, and financial metrics provide insights into your company’s true health. These measurements are essential for better decision-making.
Understanding financial indicators is required to navigate Singapore’s corporate environment and make informed judgments. The MAS Annual Report FY 2024/2025 addresses financial sector growth, digital resilience, artificial intelligence, sustainability, and anti-scam efforts, providing useful business insights.
This article provides key financial metrics and KPIs to help you evaluate profitability, liquidity, and efficiency. It discusses how to apply these measures in strategic planning. Understanding these concepts is critical for any business leader who wants to make informed decisions and achieve long-term success.
- Financial Metrics and KPIs measure a company’s performance, relevant to its strengths and weaknesses, in keeping the financial health of the company and achieving goals.
- The Gross Profit Margin, Net Profit Margin, Operating Cash Flow Ratio, and others are the key financial metrics and KPIs that give a snapshot of the business’s performance.
- Financial Metrics Effective Usage involves choosing the appropriate KPIs, establishing tracking mechanisms, and analyzing the data to guide informed and strategic decision-making.
- ScaleOcean accounting software automates real-time tracking of key financial metrics, ensuring accurate data for decision-making and improving financial reporting efficiency.

What are Financial Metrics and KPIs?
Financial metrics are measurements that are quantifiable and show how well a company is doing and how healthy it is; they can indicate strengths and weaknesses. Financial metrics offer insights that aid in making informed decisions.
However, this is different from KPIs, which are metrics used to assess the financial and operational health of a company. The indicators center primarily on critical business elements such as revenue growth, profit margins, and customer acquisition expenses, and aim to measure progress and ensure businesses remain on track with their objectives.
Financial Key Performance Indicators (KPI)
Financial KPIs are indicators that analyze the relationships among accounting elements to measure profits, revenue, expenses, and other financial metrics. The indicators are normally associated with a definite monetary value or ratio to gauge performance.
Most of the KPIs are categorised under 5 main groups depending on the data measured by the KPIs:
1. Profitability Metrics
Profitability Metrics are used to measure how much profit a company makes from its investment in sales, assets, or equity compared. They include gross profit margin, operating profit margin,n and net profit margin, which reflect a company’s cost and expense control.
This is essential to gauge the effectiveness of a business’s sales efforts when it comes to turning sales into real profits. A ratio that is higher will indicate that management is effective, market positioning is better, and that the company can weather all financial storms.
2. Liquidity Metrics
Liquidity ratios assess a company’s ability to pay its current debts with its current liquid assets. Some of the most common liquidity ratios are the current ratio and a company’s quick ratio, which indicate how quickly a company’s assets can be converted to cash to pay the company’s debts.
Operating a business demands cash flow flexibility; cash flow ratios can help ensure the business does not have to operate without cash flow problems. The word ‘liquidity’ refers to an undesirable state of a company, where there is a risk of cash flow problems or financial distress.
3. Efficiency Metrics
Efficiency indicators serve as excellent assessment and monitoring tools for businesses to make sure their resources and assets are used efficiently for selling products. In the world of business, productivity is key, with one common measure of efficiency being the asset turnover ratio and another being the inventory turnover ratio, which shows the company’s use of assets and its inventory to make sales.
Indicators are used to make sure that the processes that may be used in the business are actually applied, and also prevent any of the resources in the business from being wasted. The high efficiency is not only cost-effective, but it is also more productive and improves the performance of the company, thus increasing its profitability.
4. Valuation Metrics
The objective of valuation is to try to evaluate the market value of the company based on its financial performance. Two important ratios that can be used to evaluate the undervalued or overvalued companies in the stock market are the price-to-earnings ratio (P/E) and the price-to-book ratio (P/B).
They are signs given by investors to see whether the share price of the businesses is worth investing in. The valuation is very crucial for investments to make informed decisions, consistent with the market expectations and the growth of the company.
5. Leverage Metrics
Leverage Ratios indicate the way that a company is financed with additional debt. Ratios such as debt to equity ratio, debt to asset ratio, etc., interpret the financial risk and debtworseness of the company to reach the growth.
Managing leverage can help ensure profits, yet can additionally improve the extent of risk currently faced by the business, particularly when the economic situation is down. A successful leveraging agreement will enable a company to continue to function without having to reduce its finances.
Why These Metrics are Crucial for Singaporean Businesses

Having a fantastic product is insufficient for success. Businesses must be agile, which requires an awareness of crucial financial measures. These indicators provide the data required for an effective financial management process, which is vital to success in this situation.
Financial performance metrics must be tracked by any Singapore-based business. It enables educated decision-making, assures compliance with local legislation, and promotes long-term sustainability. This technique is not only advantageous. It is a necessity for serious business owners.
1. Make Data-Driven Strategic Decisions
When it comes to the feelings of business, metrics are able to help establish patterns, inefficiencies, and opportunities for business expansion based on data analysis. However, this will assist you when you have to make decisions strategically without getting the wrong idea, and your decisions will be more actionable + specific when you are engaging with your business.
Financial Data is measured on a regular basis and taken care of proactively. It aids in predicting future performance, establishing effective targets, and setting actionable goals. This helps to create a business that can survive and thrive in the extremely competitive business environment in Singapore.
2. Secure Funding from Investors or Banks
For investors, banks, etc., you’ll have to showcase frames, analytics, and review elements. As these numbers not only form the basis of your company’s success, but also its potential growth as well, they are essential when trying to persuade investors that it is a worthy investment.
Businesses will need to ensure that financial reporting is in accordance with the Singapore financial accounting standards to ensure compliance and provide transparency and accuracy in all financial statements.
Potential funders are more likely to be confident and trust in a financial track record. They illustrate that you have an understanding of key financial data, which helps you to demonstrate your ability to lead well. This helps to create investor confidence in your skill to return profit, which is the investor’s end goal.
3. Monitor Financial Health in a High-Cost Environment
High operational costs make financial measurements vital. All indicators, such as cash flow, profit, and debt ratios, are mere metrics, and it gives companies the chance to see how their finances pertain prior to being behind the curve in the expensive marketplace.
If there’s a single platform where organisations can scale these metrics, an extensive financial and accounting ERP system can make a significant contribution in that regard. The companies can make changes to the budget and approach by keeping vital information like burn rate and profit margin recorded.
Effective cash flow monitoring in Singapore’s tough economic landscape is crucial for business continuity and sustainability, helping to prevent cash flow issues.
4. Ensure Compliance with ACRA (Accounting and Corporate Regulatory Authority)
All the businesses in Singapore have to adhere to the criteria set up by ACRA, which includes proper financial documentation. If you record financial indicators properly, then your financial records will be up to date and in good order, and you will be able to present them for your legal requirements in a timely fashion for audit and review.
But getting the information right is essential when it comes to tax preparation and financial reporting. By continuously checking and evaluating the metrics, you can prevent the risks of being subjected to penalties, legal disputes, and stress due to noncompliance and concentrate on running your business efficiently without interruptions.
5. Benchmark Performance Against Competitors
Understanding your company’s success is critical, but comparing it to that of your competitors is even more important. Financial metrics enable you to compare your performance to industry averages and competitors, giving vital context for strategic planning and growth.
This comparison identifies strengths and drawbacks, highlighting factors such as profit margins and inventory turnover. Identifying these gaps allows you to create realistic improvement goals, which will drive your company’s performance and competitiveness.
32 Key Financial Metrics and KPIs to Measure Success in 2026
Tracking the right financial metrics and KPIs is key to understanding your business’s performance in 2026. With so many data points, it’s important to focus on the ones that offer the most meaningful insights into your financial health. Using tax software can help streamline the tracking of these metrics, ensuring accurate financial data and reporting.
Here are the key areas to keep an eye on:
1. Gross Profit Margin
Gross profit margin is the percentage of revenue that remains after deducting the cost of goods sold (COGS). A higher margin shows greater efficiency in managing production costs, which helps pay other corporate expenses. It is a major indicator of financial wellness. The formula is:
Gross Profit Margin = (Net sales – COGS) / Net sales x 100%
2. Return on Sales (ROS)/Operating Margin
Return on Sales (ROS) reflects how much operating profit a company generates from each dollar of sales after accounting for operating costs. It is calculated by dividing operating income by net sales revenue. ROS indicates a company’s ability to convert revenue into operating profit. The formula is:
Return on sales = (EBIT / Net sales) × 100%
3. Net Profit Margin
Net profit margin is the proportion of income remaining after all expenses, including taxes and interest, have been removed. A greater margin suggests that costs and expenses are well under control while profit is generated, indicating effective management. Here is the formula:
Net profit margin = (Net income / Revenue) × 100%
4. Return on Equity (ROE)
ROE assesses how effectively a company leverages shareholder equity to produce profits. A greater ROE shows that investment capital was effectively used, resulting in excellent returns and efficient business management. It reflects how effectively equity contributes to business growth. Here is the formula:
Return on Equity = Net Income / Shareholder Equity
5. Return on Assets (ROA)
ROA compares profitability to total assets, allowing you to examine how efficiently assets are used to generate earnings. A greater ROA indicates that the company is making better use of its resources and earning more money with fewer assets. Here is the formula:
Return on assets = Net income / Total assets
6. Current Ratio
The current ratio compares a company’s current assets and current liabilities. A ratio greater than 1 shows that the corporation can meet its short-term obligations, indicating financial soundness. It provides a brief overview of the company’s short-term health. Here is the formula:
Current Ratio = Current Assets / Current Liabilities
7. Quick Ratio (Acid-Test Ratio)
The quick ratio is a stricter measure of liquidity that excludes inventory from assets. It provides a more conservative assessment of a company’s capacity to satisfy short-term obligations. A ratio greater than one indicates that the company is liquid and doesn’t rely on inventories. Here is the formula:
Quick ratio = (Current assets – Inventory) / Current liabilities
8. Operating Cash Flow Ratio
The operating cash flow ratio indicates how successfully a company’s operations can cover current liabilities. A greater ratio indicates that the company can satisfy its obligations without the need for external financing, hence ensuring liquidity. Here is the formula:
Operating Cash Flow Ratio = Operating Cash Flow / Current Liabilities
9. Debt-to-Equity Ratio
This ratio compares a company’s debt to its shareholder equity, reflecting financial leverage. A high ratio suggests a higher risk due to heavy borrowing, while a low ratio indicates more conservative financing with less reliance on debt. Here is the formula:
Debt-to-equity ratio = Total liabilities / Total shareholders’ equity
10. Debt-to-Asset Ratio
The debt-to-asset ratio indicates the percentage of assets financed with debt. A smaller ratio suggests a lesser financial risk and a more stable financial position, whereas a higher ratio indicates a greater reliance on debt to fund assets. Here is the formula:
Debt-to-Asset Ratio = Total Debt / Total Assets
11. Interest Coverage Ratio
Interest coverage measures a company’s ability to meet its interest payments on debt using operating profit. A higher ratio indicates the company has a greater ability to service its debt and is less at risk of defaulting on interest payments. Here is the formula:
Interest Coverage Ratio = EBIT / Interest Expenses
12. Inventory Turnover Ratio
Inventory turnover measures how often a company sells and replenishes its inventory. A higher ratio indicates efficient inventory management and strong sales, while a low ratio suggests excess inventory or slow-moving goods, which could impact cash flow. Here is the formula:
Inventory Turnover Ratio = COGS / Average Inventory
13. Accounts Receivable Turnover Ratio
The AR turnover ratio measures how often a company collects its average accounts receivable balance over a period. A higher turnover ratio suggests efficient credit management and faster cash collection, improving liquidity and reducing credit risk. Here is the formula:
Accounts receivable turnover = Net credit sales / Average accounts receivable balance
14. Accounts Payable Turnover Ratio
Accounts payable turnover ratio shows how quickly a company pays its vendors. A high ratio may indicate good financial health, but an overly high ratio could suggest underuse of supplier credit. Accounts payable automation software can help streamline and optimize this process. Here is the formula:
Accounts payable turnover = Net Credit Purchases / Average AP balance
15. Asset Turnover Ratio
The asset turnover ratio assesses how effectively a corporation uses its assets to produce revenue. A higher ratio demonstrates greater efficiency in using assets to generate income, indicating effective asset utilization and the potential to generate more sales with fewer resources. Here is the formula:
Asset Turnover Ratio = Net Sales / Average Total Assets
16. Sales Growth Rate
Sales growth rate is the percentage increase in sales over time. Consistent sales growth implies a solid business trajectory, demonstrating robust demand and effective marketing, both of which are critical for long-term corporate expansion and investor confidence. Here is the formula:
Sales Growth Rate = (Current Sales – Previous Sales) / Previous Sales x 100
17. Earnings Per Share (EPS)
EPS measures the portion of a company’s profit allocated to each outstanding share of stock. A rising EPS signifies increased profitability and greater value for shareholders, often used to assess a company’s performance and investment attractiveness. Here is the formula:
Earnings per share = Net income / Weighted average shares outstanding
18. Working Capital
A company’s ability to pay its short-term debts is indicated by working capital, which is calculated by the difference between its current assets and current liabilities. In case the working capital is in a low position, it could definitely indicate issues with cash flow, whereas in case the working capital is too high, it can portray inefficiency. The formula is:
Working capital = Current assets – Current liabilities
19. Gross Burn Rate
Burn rate measures how quickly a company is using its available cash to cover operating expenses, particularly useful for startups. A high burn rate means the company will need additional funding soon, while a lower burn rate indicates a longer runway before funding is required. The formula is:
Gross burn rate = Company cash / Monthly operating expenses
20. Average Invoice Processing Cost
This metric tracks the average cost of processing each invoice, including labor, systems, and overhead. Lower processing costs indicate a more efficient accounts payable process, while higher costs suggest inefficiencies or reliance on manual systems.
Companies can adopt the best invoicing software, businesses can streamline the invoicing process, reduce manual errors, and lower overall processing costs, leading to greater efficiency. The formula is:
Average invoice processing cost = Total AP processing costs / Number of invoices processed
21. Selling, General and Administrative (SG&A)
The SG&A ratio calculates the proportion of revenue used to cover selling, general, and administrative expenses. A lower SG&A ratio indicates that the company is managing its operational costs efficiently, leading to better profitability. The formula is:
SG&A ratio = (SG&A expenses) / Net sales revenue
22. Budget Variance
Budget variance compares actual financial performance with the budgeted figures. A positive variance indicates better-than-expected performance, while a negative variance suggests that the company is overspending or underperforming in certain areas. The formula is:
Budget variance = (Actual result – Budgeted amount) / Budgeted amount × 100
23. Budget Creation Cycle Time
This efficiency metric tracks how long it takes to complete the organization’s budget creation process. Shorter cycle times indicate better efficiency in planning and execution, enabling quicker decision-making and resource allocation. The formula is:
Budget creation cycle time = Date budget finalized – Date budgeting activities started
24. Line Items in Budget
The number of line items in a budget represents the level of detail and granularity in financial planning. A higher number of line items reflects a more detailed approach, while fewer line items may indicate a broader view or less specificity.
25. Number of Budget Iterations
This metric measures how often a budget is revised during the creation process. A higher number of iterations can indicate inefficiencies or internal disagreements, leading to delays in finalizing the budget and affecting business planning. The formula is:
Number of budget iterations = Total versions of the budget created
26. Current Accounts Receivable
This ratio indicates how effectively a company is managing its receivables. It’s calculated by comparing unpaid but current sales to total accounts receivable. A higher ratio reflects timely payments, reducing the risk of bad debts and improving cash flow. The formula is:
Current accounts receivable ratio = (Total AR – Past due AR) / Total AR
27. Current Accounts Payable
The AP ratio shows how much of the company’s accounts payable is not yet due. A high ratio indicates that the company is paying its bills on time, while a low ratio might indicate financial strain or slow payments, which could harm supplier relationships. The formula is:
Current accounts payable ratio = (Total AP – Past due AP) / Total AP
28. Payroll Headcount
The payroll headcount ratio measures how many full-time employees are supported by each HR or payroll specialist. This efficiency metric helps assess the productivity of the HR department and its ability to manage a growing workforce. The formula is:
Payroll headcount ratio = HR headcount / Total company headcount
29. Days Sales Outstanding
DSO measures the average number of days a company takes to collect payments from customers. A lower DSO indicates faster collections, which improves cash flow and reduces the risk of overdue payments, benefiting the company’s liquidity. The formula is:
Days’ sales outstanding = 365 days / AR turnover
30. Days Payable Outstanding
DPO shows the average time it takes for a company to pay its suppliers. A higher DPO means the company is taking longer to pay its bills, improving short-term liquidity but potentially affecting supplier relationships. Managing this balance is crucial for financial health. The formula is:
Days payable outstanding = (Accounts payable × 365 days) / COGS
31. Price-to-Earnings (P/E) Ratio
The P/E ratio measures the price investors are willing to pay for a company’s earnings. A higher P/E indicates that investors expect higher future growth, but it could also suggest overvaluation. A lower P/E may indicate undervaluation or slower growth prospects. The formula is:
Price-to-earnings ratio = Market Price per Share / Earnings per Share (EPS)
32. Price-to-Book (P/B) Ratio
The P/B ratio compares a company’s market value to its book value. A ratio above 1 suggests that the market values the company higher than its book value, while a ratio below 1 could mean the stock is undervalued. It helps investors assess if a company is over- or underpriced. The formula is:
Price-to-book ratio = Market Price per Share / Book Value per Share
How to Effectively Use Financial Metrics
Financial metrics, well, just tracking them is only the beginning, isn’t it? The real power, the true value, comes from actually knowing how to put these numbers to work, using them to push your business ahead. Otherwise, honestly, they’re just numbers sitting there, not really doing anything useful.
To truly make a difference, we need to move past just collecting data and actually use it effectively in our business. This means choosing the right KPIs, setting up a reliable tracking system, and understanding the story behind the numbers. This is the point where your data becomes a strategic asset, truly.
1. Selecting the Right KPIs for Your Business Stage and Industry
Not all financial measures are equivalent. Startups concentrate on capital expenditures, but established enterprises value profitability. According to EDB Singapore, the technology sector provides US$450 billion (S$579.4 billion) in opportunities, emphasizing the importance of adjusting KPIs by company stage.
Taking the effort to understand what drives success in your industry is critical. Aligning your financial KPI metrics with these criteria guarantees that resources and attention are directed to the data that has the most impact on your company’s performance and growth.
2. Setting Up a System for Tracking
Using manual spreadsheets to maintain financial data frequently leads to errors and wastes time, particularly as your firm grows. What you truly need is a dependable system for rapidly gathering and organizing financial data to improve accuracy and decision-making.
The best accounting software automates most of the tracking process, ensuring that your data is accurate, up to date, and easy to access. This allows more time to focus on analysis and strategy, making it an essential tool for effective metric tracking and business management.
3. Interpreting the Numbers
Having the data is important, but understanding it is critical. Looking at a single metric yields little knowledge. It is critical to monitor changes over time and compare data to industry standards. For example, a regular reduction in profit margin shows the need for further investigation.
Understanding how measurements connect is essential. While rapid sales growth is desirable, it is less valuable if operational profit margins are decreasing. When appraising future projects, you should take into account elements such as the Net Present Value (NPV).
4. Avoiding Common Pitfalls
One common issue is focusing on “vanity metrics” that appear attractive but may not promote genuine business success, such as high internet traffic without conversions. To ensure effectiveness, focus on a few critical criteria that steer decisions and activities.
Another issue is “analysis paralysis,” which occurs when decision-making is hampered by an overwhelming amount of facts. Ensuring data accuracy is also critical; making judgments based on inaccurate data can be detrimental to your organization. Regularly assessing data collection methods is vital for making informed decisions.
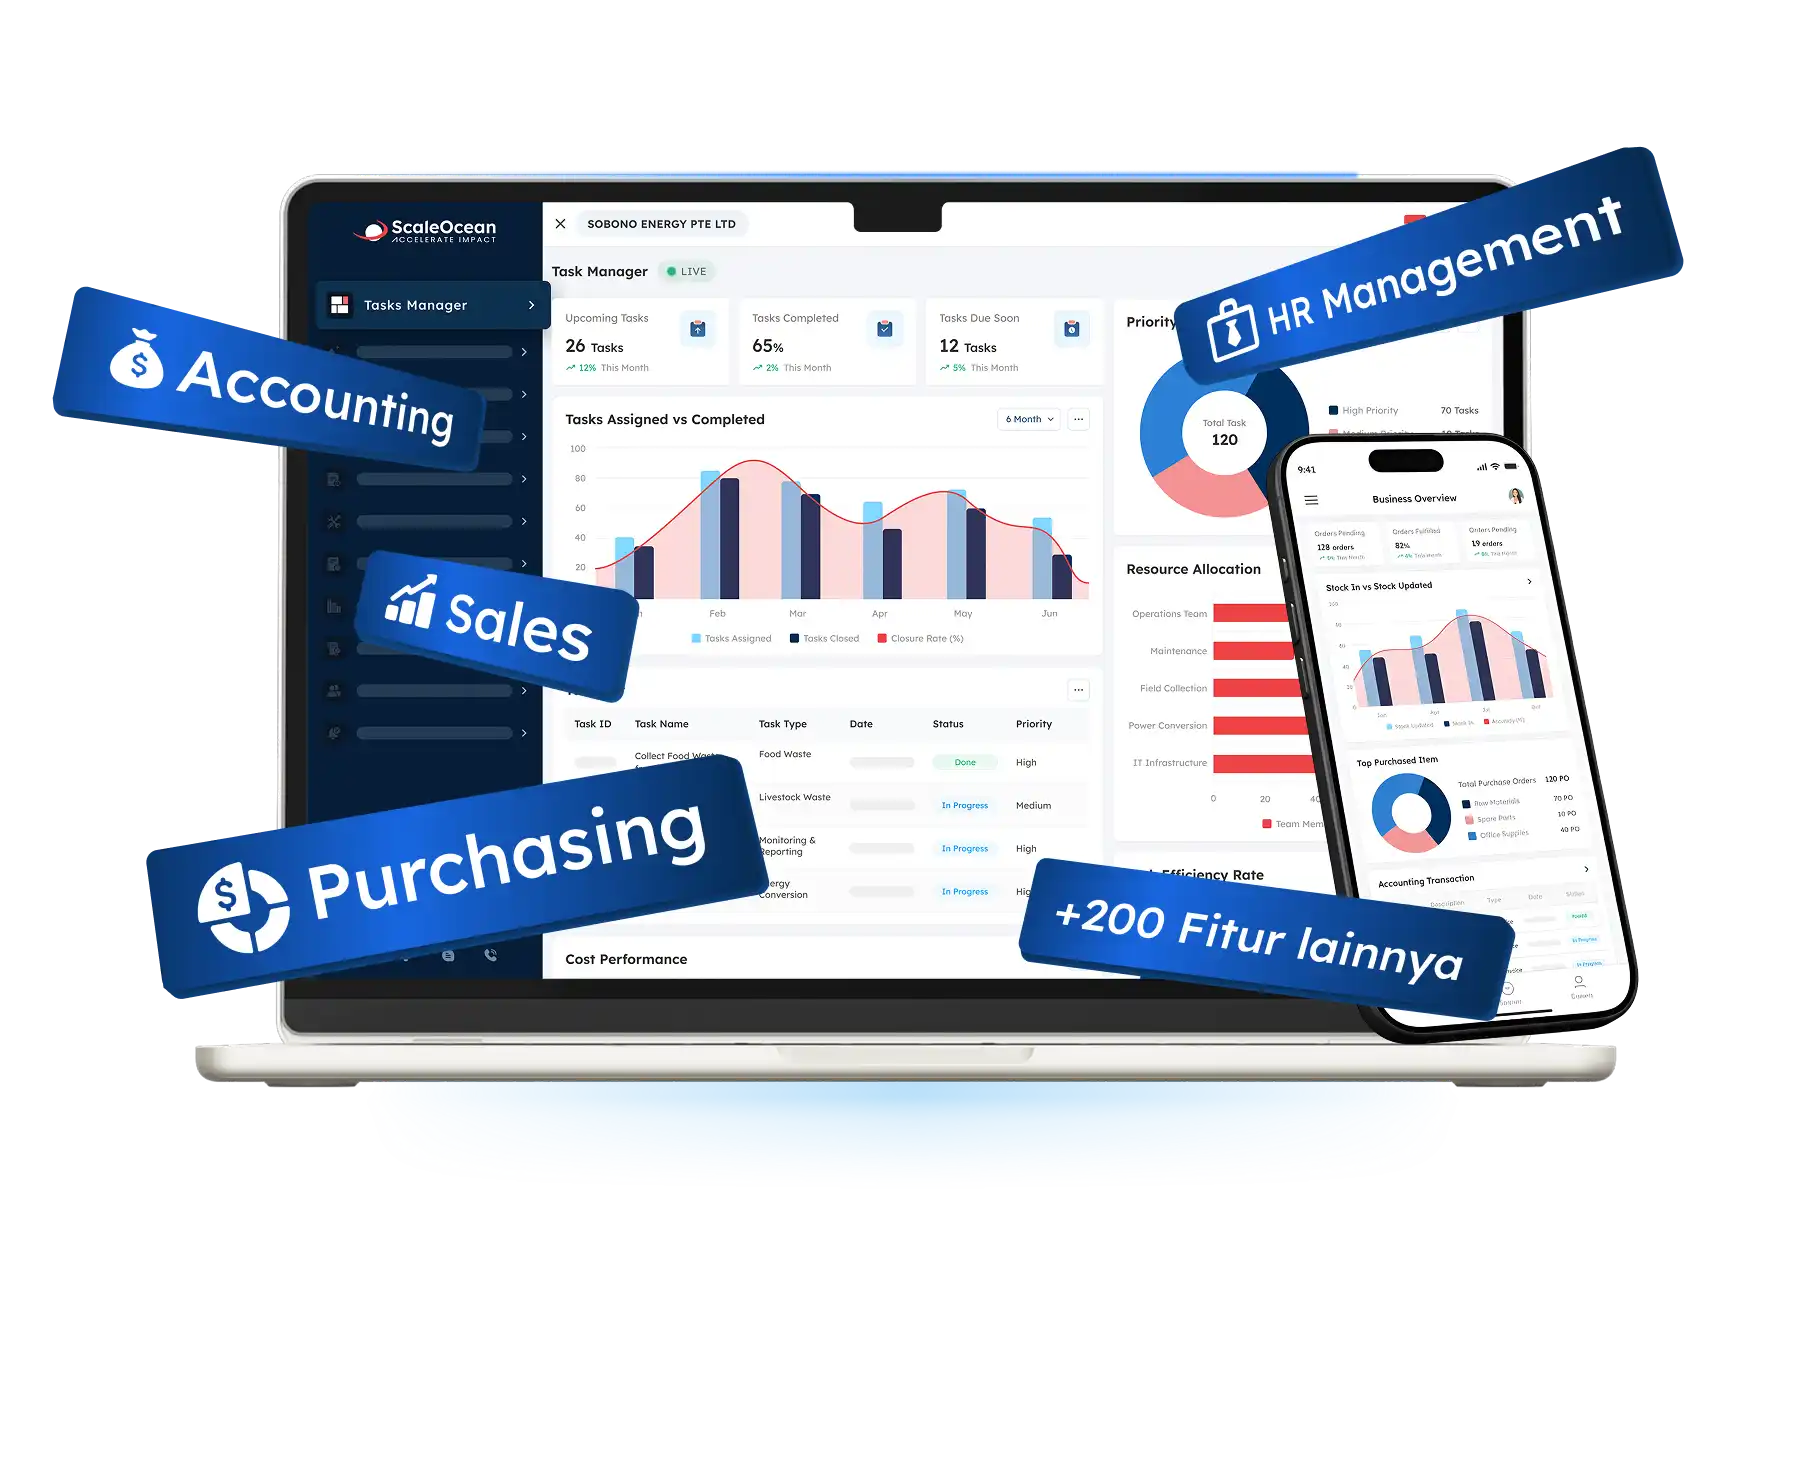
Automate Your Financial Tracking with ScaleOcean’s Accounting Software
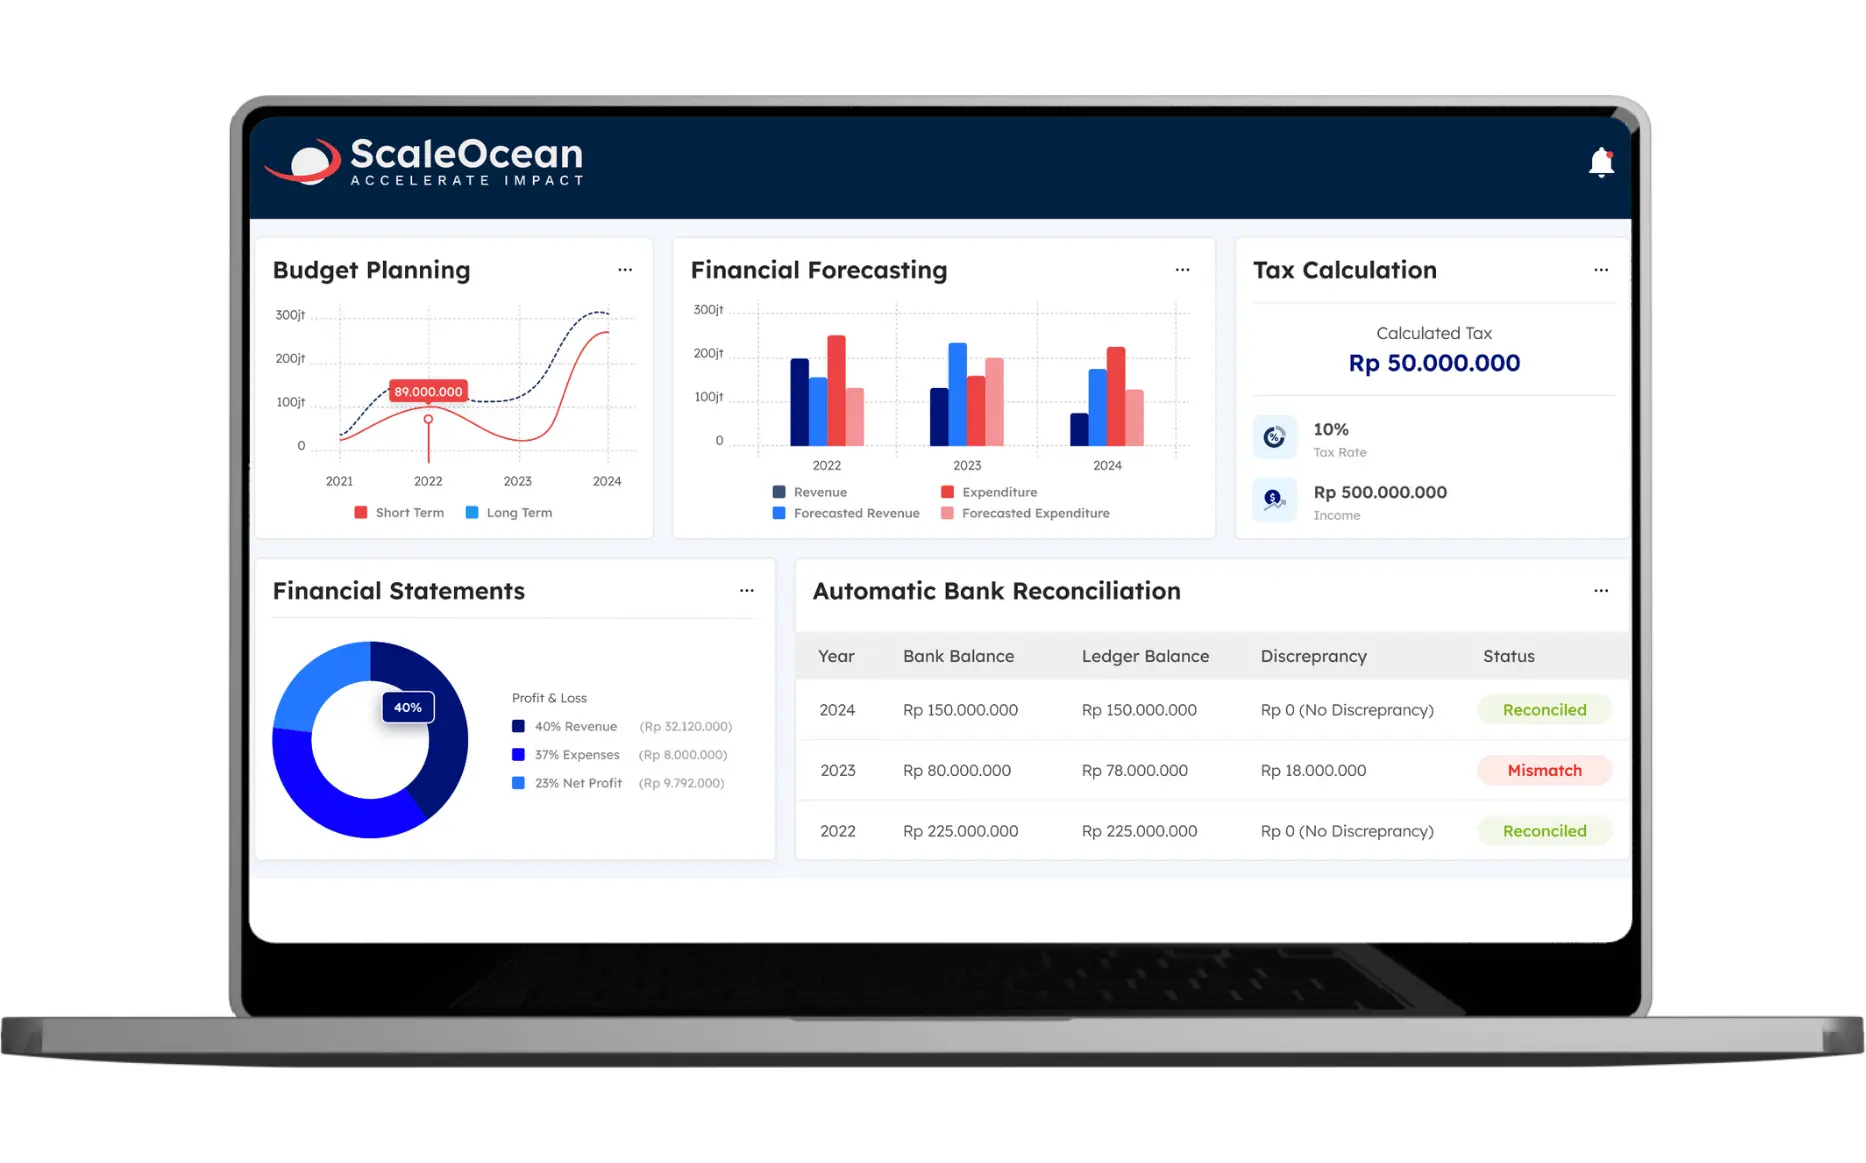
ScaleOcean’s accounting software generates and displays critical financial parameters like as profitability, liquidity, and efficiency ratios in real time. This eliminates the need for manual tracking, which is error-prone and time-consuming, allowing you to access trustworthy data at your fingertips.
ScaleOcean automates financial tracking, providing real-time data for ACRA compliance and reporting. Schedule a free demo to explore its features. Here are key features of ScaleOcean’s accounting software to help you track your financial metrics:
- Real-Time Financial Reporting: Provides instant access to key financial metrics for timely decision-making.
- Comprehensive Integration: Seamlessly integrates with other business functions to reduce manual data entry and errors.
- Automated Bank Reconciliation: Automatically matches internal transactions with bank statements for improved accuracy.
- Flexible Reporting: Customizable financial reports to meet specific business needs and ensure compliance.
- End-to-End Financial Workflow: Covers all aspects of financial management, ensuring accurate, real-time data across processes.
Conclusion
Financial indicators are critical for business success in Singapore, providing clarity and insights to assist in navigating problems and exploiting opportunities. They go beyond simple data crunching to tell the story of a company’s financial health and guide future decisions.
Companies need the necessary tools to turn financial tracking into strategic research. ScaleOcean’s accounting software automates financial tracking and analysis, delivering real-time insights and KPIs. This powerful tool enables firms to make more informed decisions and accelerate growth.
FAQ:
1. What is a financial metric?
A financial metric refers to a numerical measure used to evaluate a company’s financial performance and overall health. These metrics are essential for assessing various aspects such as profitability, liquidity, and solvency, and they help guide business decisions.
2. What is the best financial metric?
The most valuable financial metric varies by industry and business objectives. Key metrics commonly used to assess performance include Net Profit Margin, Return on Equity (ROE), and Operating Profit Margin, as they provide insights into a company’s profitability and financial efficiency.
3. What are the five key financial ratios?
The five key financial ratios often include:
1. Gross Profit Margin.
2. Operating Profit Margin.
3. Net Profit Margin.
4. Return on Equity (ROE).
5. Current Ratio.
These ratios are crucial for evaluating a company’s financial stability, profitability, and operational efficiency.
4. What are the financial metrics for KPI?
Common financial metrics used for KPIs include:
1. Revenue Growth.
2. Net Profit Margin.
3. Return on Investment (ROI).
4. Operating Profit Margin.
5. Cash Flow.
These metrics help businesses measure their financial performance and assess how effectively they are reaching their strategic goals.