

Manufacturing analytics refers to the collection and analysis of data from manufacturing equipment, sensors, materials, human resources, and IT systems for improved manufacturing decision-making. It transforms production data into actionable insights, enabling manufacturers to optimize production, enhance quality, decrease downtime, reduce costs, and increase efficiency in their supply chains.
Many manufacturing companies in Singapore are still dealing with production data in various isolated systems such as MES, ERP, WMS, spreadsheets, machine logs, and QC reports. This results in real issues in operations, including unclear reasons for downtime, poor OEE tracking, unstable yield, challenging batch cost, bottlenecked production, and poor visibility of material needs.
That is why manufacturing analytics has become a viable solution for the CEOs, plant managers, and other decision makers in manufacturing. A connected analytics system supports companies in comparing output, capacity, defect rates, machine performance, energy consumption, productivity, and costs, all in one view, to enable teams to respond more quickly and minimize guesswork in operations.
The data we received from McKinsey shows that predictive maintenance can save machines 30% to 50% on downtime and 20% to 40% of the life of the machine. This demonstrates the need for manufacturers to have analytical tools that tie production, maintenance, and machine data together to make more accurate decisions.
Read this article to find out the basics of manufacturing analytics, the four stages of manufacturing analytics, some manufacturing analytics examples, best practices for implementing manufacturing analytics, key technologies, and how ScaleOcean manufacturing software can help you to get smarter with manufacturing analytics using AI-driven workflows.
 Key Takeaways
- Manufacturing analytics helps manufacturers understand what happens, why it happens, what may happen next, and what action to take.
- Manufacturing analytics has two main lifecycles, such as analytics maturity, which defines the type of insights generated, and data processing, which manages the technical flow from raw data to actionable insights.
- AI in manufacturing will move manufacturing analytics beyond historical reporting, helping manufacturers predict risks, recommend actions, automate workflows, and improve decisions across operations.
- ScaleOcean manufacturing software enhances the management of production planning, inventory, procurement, warehouse, maintenance, quality, costing, reporting, and AI-driven workflows in a single integrated solution for enterprises.
What is Manufacturing Analytics?
Manufacturing analytics is a data-based approach that can provide manufacturers with insights into what is going on in their manufacturing, why it is going on, what it might be doing in the future, and what they should do. It processes data from the machine, operator, material, production orders, inspection results, suppliers, maintenance log, and business systems.
In practical terms, manufacturing analytics helps leaders see how the factory actually performs. It can show whether downtime comes from machine condition, missing material, operator availability, incorrect routing, supplier quality, or weak production scheduling. Without this visibility, teams often see symptoms but miss root causes.
For process manufacturing analytics, the value becomes even more important because production often depends on sensitive parameters. Food, chemical, pharmaceutical, semiconductor, and medical device manufacturers need to monitor batch data, temperature, pressure, humidity, raw material lots, and operator actions. Small variations can create major quality and cost impacts.
Manufacturing analytics also connects operational performance with business performance. Production teams can monitor machine utilization, while finance teams can calculate material usage, labor cost, scrap, rework, and overhead per batch. This helps leaders make better decisions from the shop floor to executive reporting.
 Also Read: What Is a Smart Factory? A Complete Guide
What are the Stages of Manufacturing Analytics?
Production analytics involves the gathering, structuring, and analysis of production data to maximize plant output. It usually has 2 main lifecycles, such as analytics maturity (nature of the insights) and data processing (technical process).
These stages help manufacturers move beyond static reporting. Instead of only reviewing production issues after delays happen, teams can understand root causes, predict risks, and take corrective actions earlier.
The 4 Stages of Analytics Maturity:
1. Descriptive Analytics (What Happened?)
Descriptive analytics explains what has happened in the manufacturing process. It summarizes historical and real-time data into dashboards, reports, charts, and KPIs. Common metrics include output, downtime, defect rate, yield rate, machine utilization, production cost, inventory movement, and order completion.
This stage is helpful because there are still a lot of factories where there is one version of operational truth. Data could be captured in a spreadsheet during production, or the downtime log could be maintained separately in maintenance, and the cost could be calculated at a later stage in finance.
2. Diagnostic Analytics (Why Did It Happen?)
Diagnostic analytics gives the reasons for a production problem. It assists teams in determining if a problem was caused by changes in machine condition, changes in material lots, changes in operator shifts, changes in supplier quality, changes in process settings, changes in machine routing, or changes in schedules.
For instance, a factory might be aware that there was a higher number of defects last week. Diagnostic analytics can then be used to compare inspection results, machine logs, batch numbers, supplier lots, operator records, and process parameters. This will assist quality, production, and maintenance teams to fix the real issue rather than redoing manual checks.
3. Predictive Analytics (What Will Happen?)
Predictive analytics involves forecasting and forecasting based on historical data, real-time signals, statistical models, and AI. It can forecast failure risks, shortages of materials, changes in demand, production delays, quality deviations, and bottlenecks that can cause disruptions to production.
This stage gets stronger when it links multiple data sources. While machine temperature alone might not be a strong indicator of failure risk, a combination of machine temperature, run time, vibration, maintenance history, product type, and shift data may present a stronger signal.
4. Prescriptive Analytics (What Should Be Done?)
Prescriptive analytics suggests action to take based on the data available. It may recommend an optimized production plan, preventive maintenance period, material procurement plan, machine allocation plan, QC priority inspection plan, and corrective action plan. This helps teams get from insight to execution quickly.
Prescriptive analytics takes manufacturing analytics one step further for decision makers. This is not a system that merely displays a risk. Use to help teams determine if there are alternative actions to take, like rescheduling a work order, production move to another line, safety stock increase, or supplier lot check.
The 4 Stages of Data Analytics Workflow:
1. Data Collection
Raw data is collected from sensors in the machine (IoT and SCADA), Operator logs, ERP systems, and CMMS. This stage helps manufacturers capture production activity, machine conditions, maintenance events, material movement, and operator inputs from multiple operational sources.
The data stored in the analytics system gives the manufacturer a perception of the production process, giving decision-makers the information they need to make manufacturing decisions. Combining machine data, system information, and the team’s input from the shop floor creates an accurate picture of current production processes.
2. Data Processing
This method validates, cleans, and structures large manufacturing datasets to ease analysis. Examples of such processes include deduplication, data cleansing, data formatting, time stamp synchronization, or data integration from multiple systems into a unified format.
Data processing can prevent manufacturing teams from making incorrect assumptions. Bad or incomplete data information from machine logs, ERP, maintenance reports, or operator input may result in incorrect analytics. Precise and consistent data helps teams to better compare machine, line, shift, and order production performance.
3. Data Analysis
Analytical methods such as mathematical models, statistical techniques, and data science algorithms are applied to determine patterns, instability in processes, losses in process efficiency, and risks in operations. This approach enables manufacturers to find trends that may not be apparent by manually reporting from their data or by using traditional dashboards.
Data analysis converts dense data into usable information for the decision maker, which can explain regular downtimes, help identify the influence of selected process parameters on quality, highlight unused capacity, and show the reasons for production delays of selected production steps, allowing more accurate and traceable improvements.
4. Insight Extraction & Visualization
Insight extraction and visualization translate complex manufacturing metrics into clear dashboards, reports, charts, and alerts. This stage helps frontline teams, supervisors, and site leaders understand performance quickly without manually reviewing large volumes of production data.
For manufacturing leaders, this is where analytics becomes easier to execute. Dashboards can highlight downtime trends, quality deviations, energy usage, inventory risks, or production delays, allowing teams to make evidence-based decisions and take action faster on the shop floor.
Advantages and Limitations of Using Manufacturing Analytics
Manufacturing analytics gives leaders better visibility into production performance, but it also requires the right data foundation. A dashboard alone cannot solve operational problems if machine data, quality records, inventory, labor, and costing are not connected.
The comparison below shows the major strengths and weaknesses companies should consider before implementing manufacturing analytics.
| Strengths | Weaknesses |
|---|---|
| Manufacturing analytics improves visibility across production, machines, inventory, quality, maintenance, and cost data for faster decisions. | It needs clean and integrated data to produce accurate insights and avoid misleading analysis. |
| It helps detect downtime causes, bottlenecks, quality issues, material shortages, and yield problems earlier. | Implementation can be difficult when factory data is scattered across multiple disconnected systems. |
| It supports better planning by connecting demand, capacity, material needs, labor, and machine availability. | Analytics still requires clear workflows, team accountability, and follow-up actions to solve problems. |
| It helps teams compare shifts, machines, suppliers, batches, and product lines for continuous improvement. | Teams may need training to read dashboards and use data in daily production decisions. |
Examples & Business Use Cases for Manufacturing Analytics
Based on the insight our team got from NIST, smart manufacturing systems can transform data from manufacturing processes into actionable knowledge for decision-making. This means manufacturing analytics should not only present reports, but also help manufacturers improve real execution across planning, production, quality, maintenance, inventory, and cost control.
The following use cases show how manufacturers can apply analytics to solve common operational problems. Each example also explains how analytics can turn factory data into practical actions that support faster, more accurate, and more measurable decisions.
1. Demand Forecasting
Demand forecasting uses historical sales, confirmed orders, seasonality, market trends, customer behavior, and production capacity to estimate future demand. For manufacturers, this helps planning teams decide what to produce, how much material to prepare, and when production should start.
Without reliable forecasting, sales teams may promise delivery dates that production cannot support. Manufacturing analytics helps compare demand, capacity, stock, and material availability, so companies can prevent production overloads, reduce stockouts, and align production schedules with real market needs.
2. Quality Assurance
Quality assurance analytics module helps manufacturers identify quality trends on supplier, product batch, machine, shift, process parameters, and inspection results. It can alert whether the defect is due to a machine setting change, a change in raw material batch, or a change in production line item.
In particular, for process manufacturing analytics, it is important to monitor the temperature, humidity, pressure, or raw material quality, as small temperature and pressure changes, or slight variations in raw material quality, can affect product quality. Connecting QC information to the manufacturer allows them to identify quality issues early, minimize rework, and avoid sending poor-quality products to customers.
3. Predictive Maintenance
This form of maintenance uses vibration, temperature, past machine downtimes, maintenance history, machine running history, historical operational data, as well as forecasts to anticipate potential machine failures. This allows the maintenance team to know if any warning signs may lead to work stoppages.
This use case helps manufacturers move away from reactive maintenance. Instead of waiting until equipment breaks, teams can plan maintenance before failure disrupts production. This improves machine availability, reduces emergency repair costs, and supports more stable production schedules.
4. Inventory & Supply Chain Optimization
This will enable the manufacturer to understand the availability of raw material, lead time of the suppliers, safety stock level, consumption patterns, purchase orders, and production volumes, and help it to run the supply chain smoothly and not get caught up in delays because of the unavailability of raw materials.
ScaleOcean manufacturing software combines all procurement, inventory, warehouse, and production information and enables production and procurement scheduling based on actual demand.
5. Throughput Optimization
Throughput optimization focuses on speeding up the flow of products through production. Analytics provides insights into which work orders are taking too long, machines that are bottlenecks, shifts with lower output, and production steps causing delays.
Manufacturers can track cycle time, queue time, setup time, machine utilization, and output to allow them to balance and schedule lines, maximize machine capacity utilization, and boost productivity without additional resources.
6. Fault Prediction
Fault prediction is a technique that analyzes machine data, inspection data, process parameters, and historical failure trends to identify potential manufacturing issues. This will allow manufacturers to determine the root cause of equipment problems, process instability, or quality deviations at an earlier stage than when they turn into costly failures.
For instance, analytics can be used to identify that a machine is making more defects after a specified duration. It can also reveal that faults are more prevalent when certain suppliers’ materials are used. These insights enable teams to probe deeper into when loss of production may have occurred in the past, thereby avoiding similar events from happening again.
7. Inventory Optimization
Inventory Optimization is used to ensure that raw materials, components, WIP, and finished goods are optimized for a manufacturer. It matches the demand, production schedules, lead time, minimum levels, suppliers’ availability, and consumption.
The significance of this use case is that having too much inventory will use up cash, and having too few will cause production delays. Manufacturing analytics enables companies to achieve a balance between cost and availability, particularly when they have multiple production sites, multiple products, multiple suppliers, and multiple production priorities.
8. Energy Management
Energy management analytics tracks electricity, water, steam, compressed air, gas, and other utility usage across machines, production lines, batches, and shifts. It helps manufacturers identify which processes consume the most energy and where unnecessary usage occurs.
This use case can be used to achieve cost control and sustainability objectives. Energy data can be linked to production orders, machine activity, and output volume, thus providing manufacturers with knowledge about the energy cost of the product, the efficiency of the lines, and opportunities for improvement on factory operations.
9. Product Development
Product development analytics enables manufacturers to compare design changes, test results, production feedback, defect data, supplier performance, and customer complaints. This helps to enhance the speed from prototype development to mass production.
For companies managing complex products, analytics can reveal whether design changes create production inefficiencies or quality risks. Combined with a flexible manufacturing system, this helps manufacturers improve innovation while keeping production practical and controlled.
Best Practices of Implementing Manufacturing Analytics

Manufacturing analytics works best when companies implement it with clear goals, reliable data, and strong operational ownership. The objective is not to create another dashboard, but to improve decisions across planning, production, quality, maintenance, inventory, and cost control.
The best practices below help manufacturers build analytics that can scale from one production line to multiple plants. They also help decision-makers avoid fragmented implementation, inaccurate reports, and poor user adoption.
1. Start with the Business Problem
The first step for manufacturers should be to define the problem they are looking to resolve with analytics. This could be downtime, low yield, inaccurate batch costing, material shortages, high rework, unstable demand planning, or poor machine utilization.
Business problems help keep manufacturing analytics implementation focused. Instead of capturing every possible data point, teams can define what information they need, which KPIs matter, who owns the issue, and what action should follow once insights appear.
With ScaleOcean Manufacturing Software, manufacturers can align these priorities through connected production, inventory, QC, maintenance, costing, and reporting workflows, supported by AI-driven insights for faster and more controlled execution.
2. Prioritize Data Quality and Standardization
One of the key pillars of manufacturing analytics is data quality. When machines, operators, warehouses, QC teams, and the finance team record data in various ways, the results of the analytics may be inconsistent.
Manufacturers require a consistent naming, accurate time stamps, clear material codes, reliable work order records, and consistent defect categories. This allows you to more easily compare machine, line, product, supplier, and production site performance.
3. Build a Scalable, Modern Architecture
A scalable architecture provides interoperability between ERPs, MESs, WMSs, IIoT sensors, machine systems, SCADAs, QC systems, and BI dashboards. If they are not in the right architecture, analytics can be limited to one line or one department.
ScaleOcean meets this requirement by providing a seamless ERP solution that integrates production, procurement, inventory, warehouse, quality, maintenance, finance, and reporting. This ensures manufacturers don’t end up with data that is spread across multiple sources, and that they can develop analytics that can grow proportionate to operational complexity.
4. Foster a Data-Driven Culture
If no one trusts and utilizes the data, no manufacturing analytics is going to do any good. Operators, supervisors, engineers, planners, and executives need to understand how analytics can help them make day-to-day decisions.
This implies that companies need to train the teams, establish responsibilities, and encourage the use of dashboards in production meetings. By embedding analytics into daily routines, the team can respond more quickly and measure their efforts for improvement more accurately.
5. Plan for Continuous Iteration
Business needs are dynamic, manufacturing analytics should be too. Some of the first steps may begin with monitoring downtime, and then moving on to predicting quality, managing energy, planning inventory, or analyzing production costs.
Continuous iteration can help manufacturers to improve incrementally without overloading teams. The best analytics solutions assess KPIs, enhance data quality, optimize dashboards, and introduce new use cases in the context of real-world business priorities.
Manufacturing Analytics Technologies
Several technologies are underpinning manufacturing analytics that gather, analyze, visualize, and interpret factory data. These technologies work together to establish a production intelligence layer, which is connected.
Properly matching the right technology combination is based on the industry, production model, complexity of machines, compliance requirements, and maturity of the system. It is not always necessary for manufacturers to roll out all at once, but there must be a roadmap that links data and action.
1. IIoT Platforms
IIoT (Industrial Internet of Things) platforms enable machines, sensors, and devices to be linked to the production assets to capture real-time data. Data can include vibration, temperature, pressure, runtime, energy consumption, speed, and equipment condition.
Many factories can not just depend on manual production reports, which are useful for the use of IIoT platforms. With machine data flowing into analytics on their own, teams can track performance more closely and identify shifts in performance before they turn into big operational problems.
2. Machine Monitoring & Predictive Maintenance Systems
Equipment monitoring systems record equipment performance, downtime, speed, equipment alarms, and operating conditions. These systems, when paired with predictive maintenance, can detect potential signs of wear, failure, or abnormal machine operation.
This technology assists maintenance personnel in scheduling work more effectively. Manufacturers don’t have to rely on fixed schedules, as they can determine when maintenance should occur based on the actual conditions of the machines.
3. OEE (Overall Equipment Effectiveness)
OEE (Overall Equipment Effectiveness) measures how effectively manufacturing equipment is used. It evaluates availability, performance, and quality to show whether machines are producing at their full potential.
OEE is valuable because it connects downtime, slow cycles, and quality losses into one metric. With manufacturing analytics, companies can break down OEE by line, machine, shift, product, or production order to identify the biggest losses.
4. MES (Manufacturing Execution System)
MES supports shops in managing and monitoring production execution. It monitors work orders, routing, production progress, machine use, operator activities, material usage, and quality verification.
With the integration of MES data with ERP and analytics, decision-makers can measure how well their production is being performed against planning, inventory, and finance data. This aids in determining if the delays are due to materials, schedule, machine, or quality.
5. Statistical Process Control (SPC)
Statistical Process Control (SPC) is a way for the manufacturer to use statistical techniques to observe process variation. It is typically used in quality control to determine if the process is in control.
For manufacturing analytics, SPC is particularly important for process manufacturing as production parameters impact product consistency. Real-time tracking of variation helps businesses identify early warning signs and support more accurate advanced planning and scheduling to avoid costly quality problems.
6. Data Visualization & Business Intelligence (BI) Tools
BI tools enable manufacturers to transform complicated data into dashboards, charts, and reports. They provide better data for supervisors, managers, finance, and executives to easily understand production performance.
But it is not sufficient to just visualize. Most valuable value when BI receives integrated data from ERP, MES, WMS, quality, maintenance, and machine systems. ScaleOcean does this with connected dashboards, enabling teams to track their production, inventory, cost, and performance in a single ecosystem.
7. SCADA (Supervisory Control & Data Acquisition) Systems
In today’s world, the industrial processes are being monitored & controlled in real time by a SCADA system. They gather information from equipment, sensors, and control devices, and enable operators to monitor the production process and take action if an alarm occurs.
Manufacturers that have complex or ongoing operations are important to SCADA. By combining SCADA with ERP and analytics, companies can correlate machine health to production orders, maintenance work, quality data, and costs.
The Future of Manufacturing Analytics
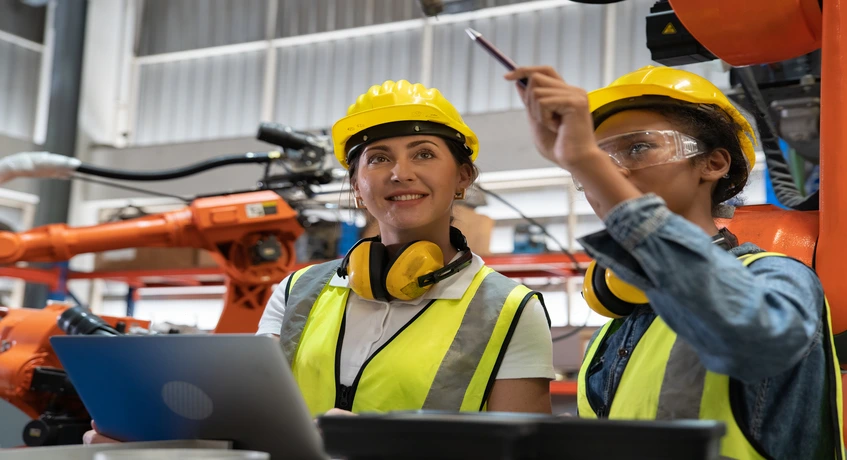
AI in manufacturing will play a pivotal role in the future of manufacturing analytics. Analytics will no longer be used just to report or refer to past factory events. It will be better and more often forecast problems, suggest solutions, automate processes, and assist in decision-making for the agent throughout the production, quality, maintenance, and supply chain processes.
By identifying patterns that can go unnoticed by humans, AI helps to make manufacturing analytics more proactive. It can identify early signs of machine failures, compare production parameters, foresee demands, prioritise maintenance tasks, suggest changes to schedules, and establish quality risks based on historical and real-time data.
In the business world, it’s not enough to have dashboards, it is essential to have AI agents to enable teams to act. An AI system with agents can read production data, identify risks, alert, propose schedule changes, link quality data, and facilitate follow-up actions in other departments.
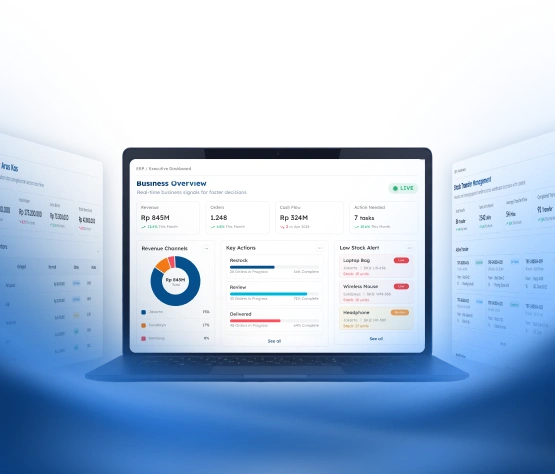
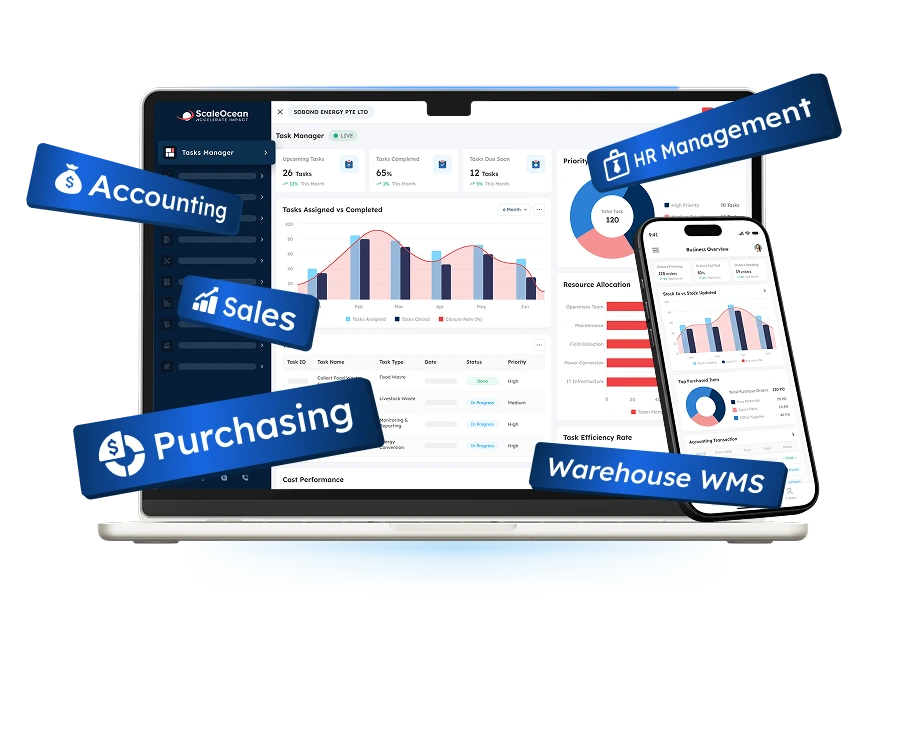
ScaleOcean manufacturing software connects production planning, inventory, procurement, warehouse, machine maintenance, QC, costing, sales, and finance in one system. This helps manufacturers build analytics that are not isolated, but directly connected to execution. Explore ScaleOcean’s free demo to see how its AI-powered insights, unlimited users, and end-to-end ERP integration help manufacturers control operations with clearer data and faster decisions.
With AI-driven and agentic workflows, ScaleOcean can help manufacturers monitor production changes, identify bottlenecks, analyze downtime, detect quality issues, recommend material planning actions, and support more accurate production scheduling.
This makes ScaleOcean more than an analytics system, because it becomes an integrated manufacturing control platform that helps decision-makers move from data visibility to guided execution, especially for complex manufacturing businesses that need real-time visibility, end-to-end data integration, and scalable production control.
Conclusion
Manufacturing analytics involves gathering and analyzing data from factory machinery, sensors, and IT systems. It turns that data into actionable intelligence that can help you to optimize production, minimize equipment downtime, minimize losses, and enhance your supply chain effectiveness.
Without the right platform, manufacturers can face scattered data, unclear downtime causes, inaccurate OEE, unstable yield, material shortages, high rework, difficult batch costing, and weak production visibility. A connected analytics system helps companies reduce guesswork, improve planning accuracy, and make faster operational decisions.
ScaleOcean Manufacturing Software enhances the management of production planning, inventory, procurement, warehouse, maintenance, quality, costing, reporting, and AI-driven workflows in a single integrated solution for enterprises. Experience how to streamline manufacturing analytics and enhance manufacturing control with ScaleOcean and try out the free demo today!
FAQ:
1. What goals can manufacturing analytics help achieve?
Manufacturing analytics helps companies gain clearer production visibility, minimize downtime, maintain consistent quality, manage inventory more efficiently, control costs, predict demand, increase machine utilization, and make quicker decisions across factory operations.
2. Is manufacturing analytics only useful for large factories?
No. Manufacturing analytics can benefit manufacturers of any size that need clearer visibility into production, quality, maintenance, materials, and costs. Larger factories may see greater impact because they handle more complex data, machines, teams, and workflows.
3. What data is needed for manufacturing analytics?
Manufacturing analytics typically uses data from work orders, BOM, machine logs, downtime reports, QC results, material consumption, inventory transactions, labor hours, supplier lead times, energy usage, maintenance records, and production schedules.
4. Which KPIs should manufacturers track with manufacturing analytics?
Manufacturers can monitor KPIs such as OEE, downtime, cycle time, throughput, yield rate, defect rate, scrap rate, rework cost, machine utilization, schedule adherence, inventory turnover, production cost per batch, and energy consumption.





















.png)