
When there’s no business analytics, finance, sales, and operations each run on separate dashboards. Different stories emerge from the same KPIs, predictions drift far from actual results, and patterns show up only once income drops. In Singapore’s data-heavy scene, delayed insights cost money without making noise.
According to Imarc Group, Cloud-driven ERP tools are shaping Singapore’s software growth, pushing the market forward. Growth clocks in around 11.02% yearly through 2033. Real-time reports matter more now, and data insights play a bigger role than before.
Business analytics matters because it brings finance, sales, and operations into one clear picture. Teams can track performance in real time, spot inefficiencies sooner, and build more accurate forecasts, allowing leaders to move faster with confidence.
This article dives into what business analytics means, using everyday situations to show its role. Because insights shape choices, the way data guides actions becomes clearer here. A look at common tools follows, tied closely to real impact on results, and how teams use numbers to adjust work that comes up along the way.
- Business analytics is a statistical method to turn raw data into insights that actually support better decisions for business performance.
- Business Analytics Tools help businesses process, analyze, and visualize data to uncover insights, improve decisions, optimize operations, and support forecasting and performance tracking.
- Business analytics offers numerous benefits that help businesses optimize operations, improve performance, and drive growth through data-driven decisions.
- ScaleOcean ERP provides a comprehensive business analytics solution that integrates seamlessly with its ERP system to streamline analytics processes.
What is Business Analytics?
Out of messy numbers comes clarity; that’s when business analytics steps in. Because trends hide in plain sight, spotting them means using math carefully. When people study what has already unfolded, they start seeing rhythms nobody noticed before.
With those rhythms clear, guessing tomorrow feels less like luck. Decisions gain strength simply by knowing what typically follows what came just now. Out of that comes smarter routines, thanks to forecasting tools and digging through numbers, and when companies see chances to grow a little earlier, they keep up – choices rooted in evidence beat guesses every time.
Business Analytics Tools and Methods
After you understand what business analytics is, we will continue to discuss how a firm’s analytics tools exist in a variety of forms, with each serving a different purpose based on the complexity of the study and the size of the firm. Also, these tools enable businesses to effectively use data, streamline operations, and make educated decisions.
The following are the main components of business analytics tools:
- Data discovery: Helps uncover patterns, trends, and anomalies by exploring large datasets, enabling teams to find insights that may not appear in standard reports or predefined metrics.
- Data handling and governance: Manages data quality, consistency, and access rules. Supported by application integration tools, it ensures data flows reliably and remains accurate and secure.
- Data warehouse systems: Centralize data from multiple sources into one repository, allowing businesses to store historical data efficiently and support analysis and reporting needs.
- Data visualisation: Converts data into charts and dashboards that are easy to read, helping stakeholders quickly understand insights and make informed business decisions.
- Business forecasting: Uses historical data and models to predict future outcomes, helping businesses plan, anticipate demand, and reduce uncertainty.
- Performance reporting: Delivers structured reports to track KPIs and key metrics, supporting regular monitoring and evaluation against business targets.
- Machine learning algorithms: Use automated models to learn from data and improve predictions over time, supporting pattern detection and scalable analytics.
- Text analytics: Extracts insights from unstructured text like emails or reviews, helping organizations understand sentiment, themes, and recurring topics.
- Statistical analysis: Applies mathematical techniques to analyze data relationships and variability, supporting deeper insight into trends and business drivers.
Business Analytics vs. Business Intelligence vs. Data Analytics
In the data journey, business intelligence sits closest to daily tracking. It keeps reporting consistently through dashboards and routine updates, so teams can follow KPIs, spot changes early, and keep execution aligned with targets across functions.
Business analytics picks up where BI stops by connecting results to actions. It helps teams dig into why performance shifts, test scenarios, and project outcomes, so leaders can plan with more accuracy, tighten processes, and decide with clearer context.
Data analytics works deeper in the engine room by handling data processing and modeling at scale. It surfaces patterns and relationships that power both BI and analytics, helping businesses build stronger insight pipelines and support long-term growth decisions.
Here is the summary of the differences in the form of a comparison table:
| Function | Role in the Data Journey | Key Questions |
|---|---|---|
| Business Intelligence | Translates historical data into dashboards and reports for daily performance monitoring and operational control. |
|
| Business Analytics | Examines performance changes and evaluates actions to support planning, forecasting, and decision making. |
|
| Data Analytics | Processes and models large datasets to uncover patterns that support both intelligence and analytics. |
|
Key Types of Business Analytics
Business analytics methods and approaches enable organisations to transform data into actionable business advice. Every method serves a specific purpose, ranging from analyzing historical results to influencing future decisions, from planning to execution to growth, all designed to provide insights that can help inform decision-making, planning, execution, and growth.
Here are some of the ways analytics is used throughout the decision-making process:
Descriptive analysis
Descriptive analysis is used to summarise previous data, making it easy to see what has occurred. It transforms raw data into reports and dashboards, providing a more transparent view of performance trends and patterns throughout the day-to-day business.
This approach is able to display data in simple metrics and visuals, which facilitates regular monitoring. Teams leverage it to track performance against previous results, maintain transparency across roles, and maintain execution consistency with goals.
Diagnostic analysis
Diagnostic analysis is the next step that determines why the results increased or decreased. It analyses datasets, identifies unusual changes, and links signals that can help teams find the true causes of performance changes.
Deeper context can help companies differentiate between symptoms and root causes. This helps to problem solve by relating results to factors and allows actions to be taken to remedy the situation, rather than the feeling of “just anything”.
Predictive analysis
Predictive analysis is about learning from past trends and making estimates about the future. Businesses can predict changes in demand, performance changes, and risks earlier using statistical models.
This approach helps improve planning through diminished uncertainty in forecasting. It also supports Enterprise Risk Management (ERM) through testing of assumptions, scenario planning, and the development of strategies that are consistent with the market and operations.
Prescriptive analysis
Prescriptive analysis is more about taking insights and making the best next decision. It examines various situations and makes recommendations that can help achieve business objectives in a timely manner without overlooking other considerations and constraints.
With analytics and decision models, leaders can make more informed decisions. It helps facilitate execution by ensuring that actions are aligned with anticipated results and operational constraints, not just hunches.
How Does the Business Analytics Process Work?
The business analytics process shows how raw data becomes insights that guide better decisions. It follows a clear flow, from collecting information to interpreting results, so insights stay accurate, relevant, and useful across teams.
The process usually follows these key steps:
Step 1: Gathering Relevant Data
This step is about pulling data from sources like finance systems, sales tools, operations platforms, and customer channels. The goal is to capture real business activity and the signals needed to support reliable analysis.
By bringing data together from different functions, teams avoid working in silos. A wider dataset helps create a fuller view of performance, customer behaviour, and operational patterns across the organization.
Step 2: Cleaning and Organizing Data
After data is collected, it needs to be cleaned to remove errors, duplicates, and inconsistencies. Organising it into a structured format keeps the analysis accurate and prevents misleading conclusions later on, especially in Business Process Management (BPM) workflows.
This step also ensures everyone uses the same definitions for key metrics. When numbers follow consistent rules, teams can compare results with confidence and build insights on a shared foundation.
Step 3: Analyzing the Data
Here, teams apply analytical techniques to spot patterns, trends, and relationships. They look at performance drivers, compare scenarios, and connect results to business context, so findings are easier to act on.
With proper analysis, businesses see more than surface-level numbers. It supports forecasting and planning by linking data signals to real operational impact and clearer strategic decisions.
Step 4: Visualizing and Interpreting Insights
The last step turns analysis into charts, dashboards, and summaries that are easy to follow. Clear visuals help stakeholders understand what matters quickly, even without deep technical knowledge.
Interpretation then ties insights to action by explaining what the results mean for the business. When insights are presented clearly, leaders can align decisions with goals and move forward with confidence.
Benefits of Business Analytics for Businesses
Business analytics provides numerous advantages that assist firms in optimizing their operations, increasing performance, and driving growth. Businesses may use data to make more informed decisions, cut expenses, improve efficiency, and better understand their customers. Here’s how business analytics can help your corporation:
- Improved decision making: Supports decisions with data-backed insights instead of assumptions, helping leaders act faster, evaluate options clearly, and reduce uncertainty in strategic and operational choices.
- Unified view of business data: Combines data from multiple functions into one consistent view, connecting key performance metrics so teams avoid silos and align decisions across departments.
- Cost reduction: Helps identify inefficiencies, waste, and cost drivers across operations, allowing businesses to control spending, optimize resources, and improve overall financial performance.
- Improved customer service experience: Enables better understanding of customer behavior and preferences, helping teams respond faster, personalize interactions, and deliver more consistent service quality.
- Operational efficiency: Improves process visibility and performance tracking, allowing teams to streamline workflows, reduce delays, and maintain smoother day-to-day operations.
Who Uses Business Analytics?

Business analytics is crucial in many areas, including retail, healthcare, manufacturing, and financial services. These industries rely on data-driven insights to manage operations, improve consumer experiences, and remain competitive in the market.
Corporate analytics may help firms identify patterns, trends, and areas for improvement that are critical for corporate success and innovation. Executives, analysts, operations managers, marketing teams, and finance specialists all play important roles in firms that benefit from business analytics.
These professionals use business analytics to get important insights into performance, customer behavior, and operational trends. By exploiting these insights, businesses may make more educated decisions that result in better outcomes, such as cost savings, increased efficiency, and greater strategic direction.
The Roles of Business Analytics
The roles within business analytics define how data is transformed into insights that support decisions. Each role contributes at a different stage, from preparing data to interpreting results, ensuring analytics delivers value across the organization.
This structured collaboration is proven in practice. According to Government Executive, the federal government has applied a smart data approach for over 30 years, maintaining data integrity and operational efficiency when managing large-scale contracts and grants.
These key roles explain how business analytics functions in practice:
- Data science professionals: Focus on advanced modeling and predictive techniques to uncover patterns and future trends. Their work supports forecasting, scenario analysis, and strategic insights that guide long-term planning.
- Data engineering specialists: Build and maintain data pipelines that ensure information flows smoothly between systems. They focus on data reliability, scalability, and structure so analytics teams can work with accurate data.
- Business data analysts: Translate data insights into a business context through reports and analysis. They help stakeholders understand performance, identify opportunities, and support day-to-day decision making.
To support this data-driven approach, ScaleOcean ERP offers an integrated platform that centralizes data, enforces governance, and ensures accuracy across functions. It helps businesses turn reliable data into actionable analytics while maintaining control, security, and long-term scalability.

Challenges in Implementing Business Analytics
Business Analytics is not only about the tools; it is as much about the effective use of data, people, and systems. If the foundations are not in place, then analytics projects may not provide the organization with the results that they need and the value over time.
Some of the issues businesses might encounter are:
- Data quality issues: Incomplete, inaccurate, or inconsistent data can skew analysis results and result in poor decisions and insights if there is no data cleaning or validation process.
- Lack of skilled Analysts, Data Scientists, and IT Professionals: Limited analytics talent hampers companies from effectively using analytics and tools to understand and interpret complex data.
- Integration complexity: The complexity of integrating multiple platforms can be challenging and lead to disruption of workflows if not managed carefully when implementing advanced analytics systems.
- Expensive implementation: Tool infrastructure and expertise can be a significant challenge, particularly for smaller companies with smaller budgets and competing priorities.
Reasons Why Business Analytics is a Tool of The Future
Business analytics is playing an increasingly important role in the fast-changing business world to remain competitive. Advancements such as artificial intelligence (AI), machine learning, and automation are revolutionizing the way that companies process and analyze data, offering more insight and information to help make better decisions.
ERP systems can help with this by connecting business processes and providing real-time data access, enabling businesses to synchronize their operations and optimize enterprise management. Business analytics can help businesses adapt to market changes quickly, optimize performance, and make better decisions promptly.
ERP systems bring all the data into a single platform, helping businesses to proactively spot trends, resolve issues, and capitalize on opportunities for long-term business growth and staying competitive.
ScaleOcean: A Comprehensive ERP and Business Analytics Solution
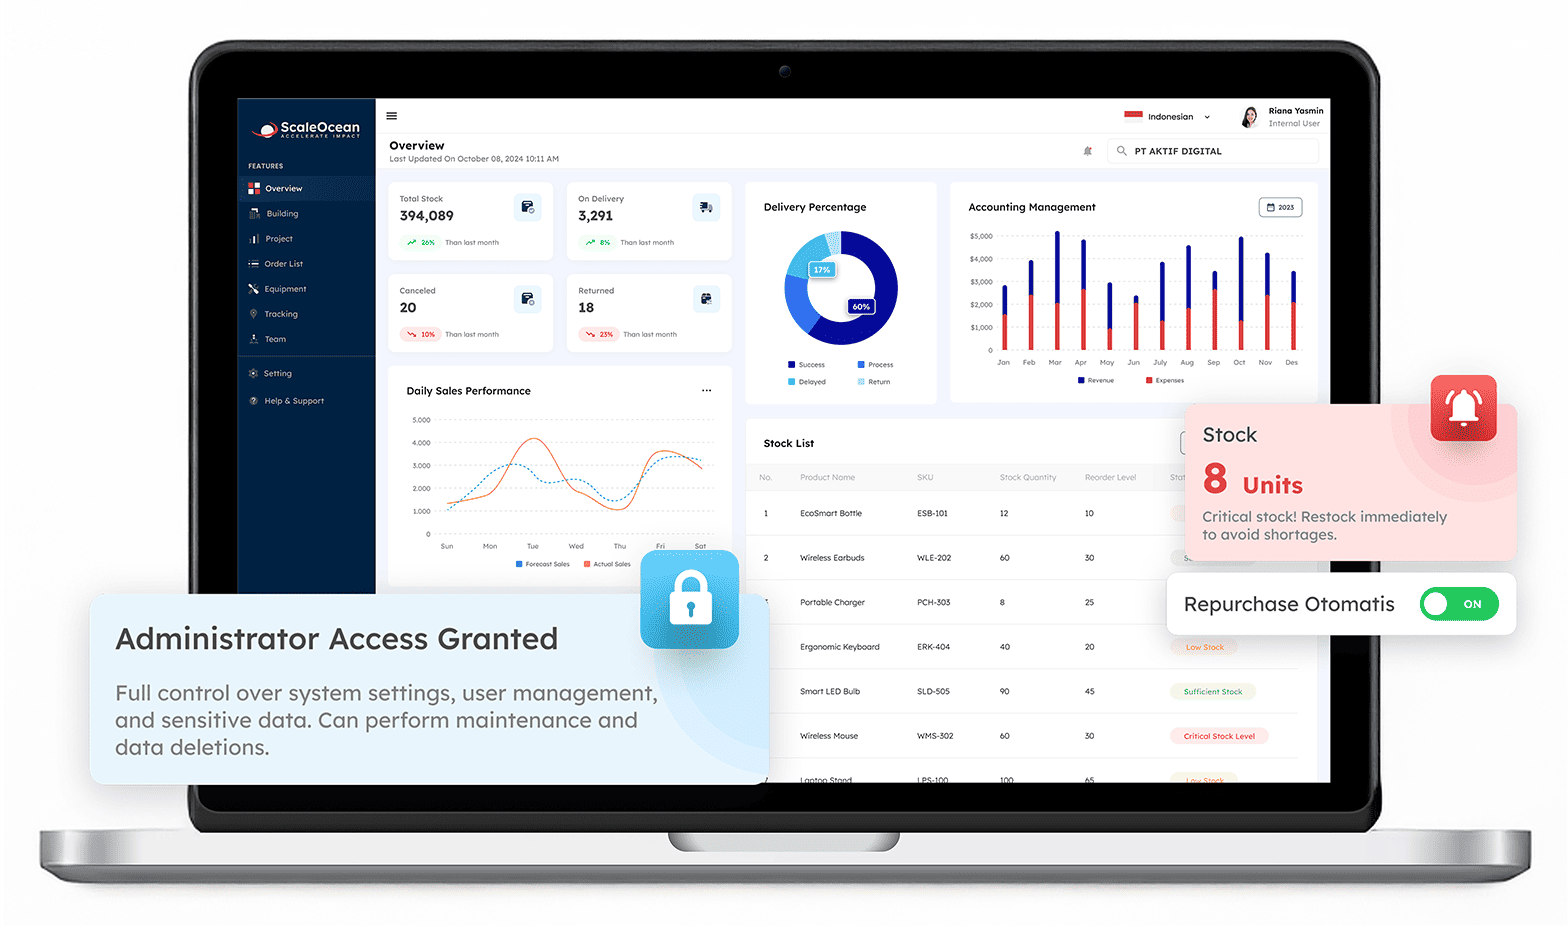
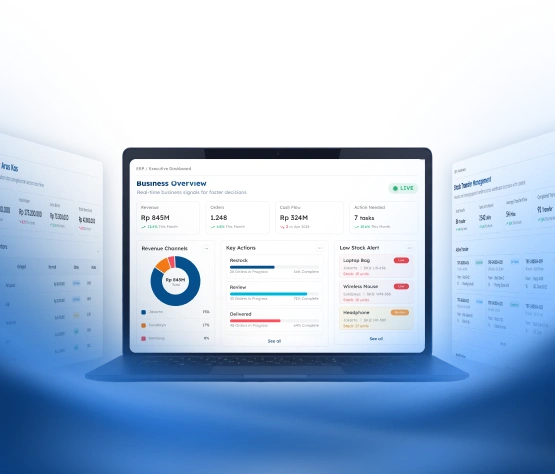
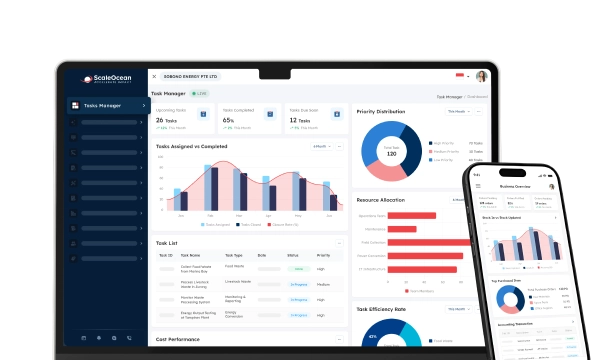
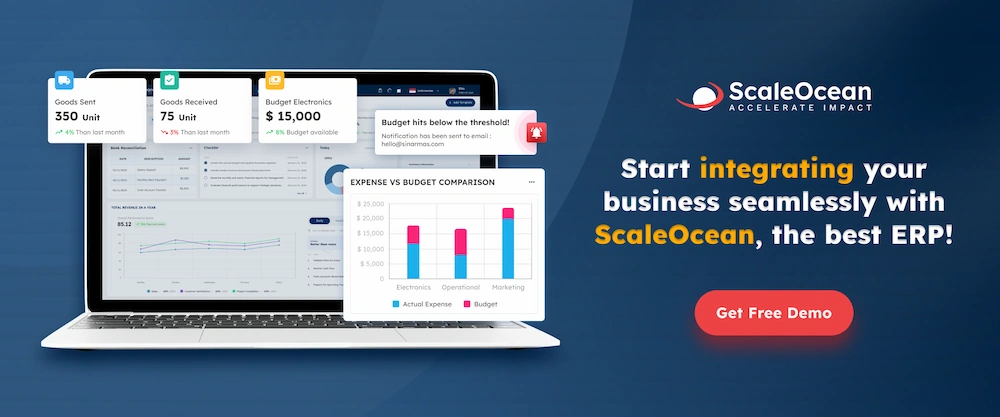
ScaleOcean offers a comprehensive business analytics solution that streamlines analytics processes within an integrated ERP system. With real-time data analytics, user-friendly dashboards, and seamless integration with other business systems, businesses can quickly access critical insights.
The platform’s simplicity ensures easy data retrieval, helping organizations improve operations and performance. By combining business analytics with ERP functionalities, ScaleOcean optimizes both data analysis and overall workflow management.
Companies may use ScaleOcean’s strong business analytics solutions to make more educated, data-driven decisions that improve performance and drive growth. ScaleOcean’s ability to monitor important indicators, predict trends, and identify areas for improvement enables enterprises to move quickly and efficiently.
Take advantage of ScaleOcean’s free demo to see how it may improve your decision-making processes. Additionally, with the CTC grant available, businesses can further lower the cost of deploying this solution.
Here is a list of ScaleOcean’s primary USPs:
- Unlimited User Access for Scalable Analytics: ScaleOcean offers 100% unlimited user access without any additional costs, allowing businesses to scale without worrying about added expenses.
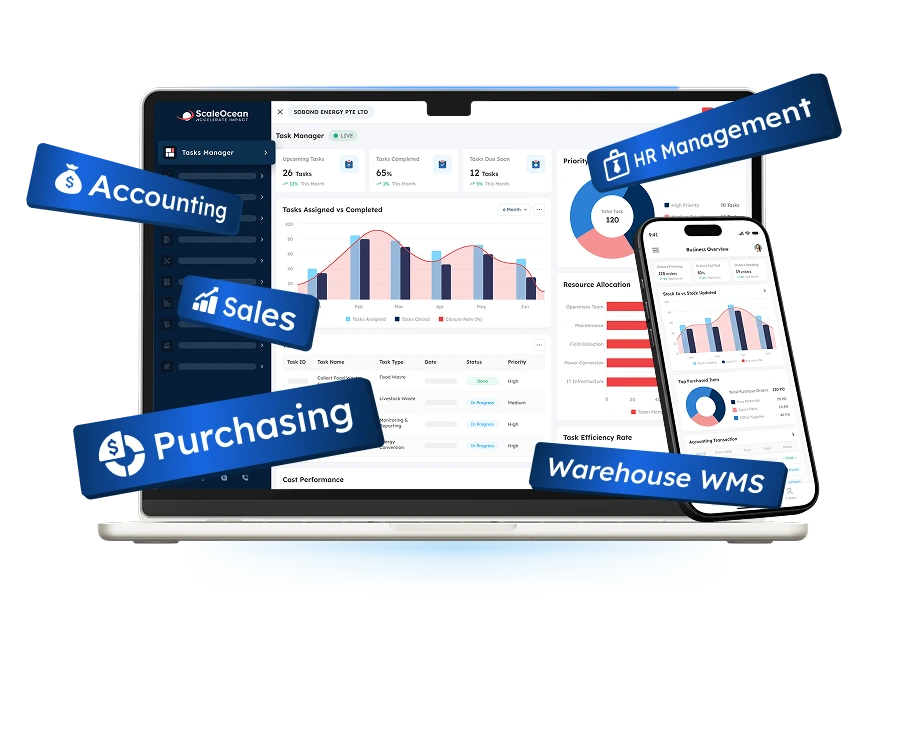
- Comprehensive, All-in-One Solution for Tailored Analytics: With over 200 specialized modules and 1,000+ feature options, ScaleOcean provides a comprehensive and customizable solution tailored to the specific needs of your business.
- Industry Best Practices for Seamless Data Insights: Designed to address the challenges of various industries, from operations management to automation, ScaleOcean leverages best industry practices to deliver a seamless analytics experience.
- Customizable Analytics to Fit Your Business Needs: ScaleOcean allows businesses to tailor the solution to their specific workflows.
Conclusion
Integrating business analytics into your operations is no longer a choice; it is necessary for long-term success and sustaining a competitive advantage. Businesses can use data-driven insights to improve performance, make educated decisions, and identify opportunities that would otherwise go undiscovered.
Understanding patterns, forecasting future results, and streamlining procedures are critical for success in today’s data-driven environment. Exploring strong analytics solutions such as ScaleOcean is critical for completely unlocking your data’s potential and improving business outcomes.
ScaleOcean, with its comprehensive capabilities like real-time data analytics and configurable solutions, may assist your organization in realizing the full potential of its data. Don’t miss out on ScaleOcean’s free demo, which will show you how its solutions may alter your decision-making process and promote corporate growth.
FAQ:
1. What skills are needed for business analytics?
Core Business Analytics Skills:
1. Strong communication skills.
2. Curiosity and a questioning mindset.
3. Problem-solving ability.
4. Critical thinking.
5. Data visualisation skills.
6. Detail-focused, while seeing the bigger picture.
7. SQL proficiency.
8. Statistical programming languages.
2. Is an MBA or business analytics better?
The decision between an MBA and business analytics depends on individual career goals. An MBA provides comprehensive management knowledge, ideal for leadership roles, while business analytics focuses on data-driven decision-making and analytical tools, making it a better fit for roles centered around data analysis and business optimization.
3. Is business analytics a good career?
Business analytics is a promising career, with growing demand for professionals skilled in data analysis. Companies are increasingly turning to data to drive decisions, creating numerous opportunities for those specializing in business analytics, such as data analysts and data scientists, across industries.
4. Is SQL a data analytics tool?
For many practitioners, SQL is a key tool for data analytics. It is commonly used to retrieve, clean, and examine data stored in databases. SQL is straightforward to pick up, yet capable of supporting complex analysis at large organizations.