
A Gantt chart is a project management tool that visually represents a project’s schedule, showing tasks with bars indicating start and end dates. It helps project managers track progress, meet deadlines, and allocate resources effectively. Gantt charts improve workflow visibility, time management, and communication.
In Singapore’s competitive market, adopting such tools can enhance project outcomes. According to EDB Singapore, a 2021 McKinsey survey found that 94% of manufacturing companies using Industry 4.0 technologies, including Gantt charts, maintained operations during the COVID-19 pandemic.
In this post, we’ll look at how to design and use Gantt charts successfully for project management. We will go over the necessary procedures for making a Gantt chart, the major elements that make it a useful tool for organizations, and typical pitfalls to avoid.
This article is intended to help businesses, particularly those managing complex projects, understand the actual application of Gantt charts and how they may contribute to better project planning and execution.
- A Gantt chart is a visual project management tool that helps track project timelines by displaying tasks with start and end dates, ensuring deadlines are met.
- The benefits of using a Gantt chart include improved project visibility, better time management, optimized resource allocation, and enhanced communication across teams.
- To create an effective Gantt chart, follow a step-by-step approach that includes defining project scope, breaking down tasks, setting durations, and regularly updating the chart for progress tracking.
- ScaleOcean’s HRIS software integrates Gantt chart capabilities, allowing businesses to manage projects efficiently, track progress in real time, and optimize resource use while ensuring teams meet deadlines.
What is a Gantt Chart?
A Gantt chart is a visual tool used in project management to depict a project’s timetable. It shows tasks or activities on a horizontal axis, with bars reflecting the start and end dates for each task. This enables project managers to readily track the progress of each activity, ensuring that all tasks are completed on schedule.
The Gantt chart’s visual design allows teams to quickly grasp the entire timeline and understand the project’s flow. A Gantt chart, by demonstrating task dependencies, aids in determining which tasks are dependent on the completion of others.
This allows project managers to better coordinate workflows, ensuring that no tasks are delayed needlessly. It is a crucial tool for scheduling, resource allocation, and progress tracking, making it a critical component of successful project management techniques.
Gantt Chart History
Henry L. Gantt developed the Gantt chart in the 1910s as a tool for better production schedule management, primarily in factories. Its design aims to make it easier for managers to track job progress by visualizing timelines, task dependencies, and project milestones.
This was a huge improvement in project management, as it provided a clear and systematic approach to dealing with difficult tasks. Gantt charts were eventually used in a variety of areas other than manufacturing, including construction, software development, and marketing.
Today, it is an essential tool for project managers, helping them to effectively plan, monitor, and manage projects. Its versatility and capacity to offer real-time updates on job status and progress have made it critical for successful project execution in a variety of sectors.
What Is the Main Purpose of a Gantt Chart?
The main purpose of a Gantt chart is to turn a project idea into a workable plan from day one. It lays out the order of work, shows what must happen first, and helps you map the path from start to finish. So it feels concrete. For everyone.
Once work is moving, a Gantt chart becomes your go-to reference for smart decisions. If a task shifts, you can see what it affects next and adjust the plan calmly. It keeps changes from turning into chaos. For example, slip QA launch slips now.
And because everyone looks at the same timeline, a Gantt chart sets clear expectations. It shows who is meant to do what, and when each handoff should happen. That shared roadmap supports accountability without extra meetings. All week too.
Core Components of a Gantt Chart
A Gantt chart is an effective tool for organizing and visualizing project timetables, and it includes several key components that make tracking activities and progress simple. These components provide clear insights into project timing, dependencies, and resource allocation, helping project managers keep organized and on track.
The following are the main components of a Gantt chart:
Tasks
Tasks represent individual activities or milestones that the project must complete. Each task focuses on a specific aspect of the project and is divided into smaller, achievable segments.
The chart presents tasks vertically to ensure the project covers every area, making it easy to track progress and completion.
Timeline
The timeline is the Gantt chart’s horizontal axis, representing the project’s total duration. It is broken down into smaller parts, such as days, weeks, or months, depending on the project’s scale.
This enables project managers to see when tasks are scheduled to start and end, providing an overview of the project’s progress across time.
Bars
The bars on a Gantt chart visually depict each task’s time. Each bar on the timeline corresponds to the task’s start and finish dates.
The length of the bar indicates how long the work will take to complete, and its placement on the timeline represents the project’s sequence of events. Bars make it simple to tell which jobs are active and which are complete.
Dependencies
Dependencies are relationships between tasks in which the start or completion of one activity is contingent on the completion of another.
These dependencies are commonly depicted by arrows that connect related tasks, allowing project managers to see which tasks must be accomplished before others may begin. This feature is critical for ensuring logical flow and avoiding delays.
Progress Tracking
Progress tracking enables project managers to monitor the status of each task in real time. As teams finish tasks, they update the progress bar within the task to show the percentage of completion.
This tool enables teams to quickly assess how much of the project they have accomplished and identify any tasks that are falling behind schedule.
Key Milestones
Key milestones are the big moments in your Gantt chart, like when a phase is done or a delivery goes out. For example, “Design approved” or “Go live” helps everyone see progress fast and spot slips early. It keeps the plan easy to read, too.
Once milestones stand out, it’s simpler to coordinate work across teams. Say marketing waits for “Feature freeze” before writing copy. These markers act like anchors, linking tasks, dates, and owners into one clear timeline view each week!
Essential Resources
Essential resources are the people, tools, and materials your tasks rely on in a Gantt chart. For example, a “QA tester” and a “test device” might be needed for the testing task, so you plan capacity and timing. That way, work doesn’t stall.
When you assign resources on the chart, you can see who owns what and when they are needed. For instance, if the same designer is booked for two tasks on Friday, you can shift one task earlier to avoid a clash. It keeps plans realistic, too.
Key Features of a Gantt Chart
Gantt charts are an effective project management and organization tool, with a variety of features that help to expedite the planning, monitoring, and tracking processes. These characteristics ensure that all activities are completed on time and that resources are used effectively.
Here are several essential qualities that make Gantt charts useful for project management:
Task Scheduling
Gantt charts help project managers schedule work with precision. Managers can ensure that the project is finished on time by assigning each task a specific start and end date.
The chart displays the complete project timetable, allowing teams to spot potential delays early and make adjustments as needed.
Task Dependencies
One of the most useful aspects of a Gantt chart is the ability to show task interdependence. These dependencies demonstrate how tasks are linked together and which tasks must be accomplished before others may begin.
This guarantees that the project moves forward smoothly, with each task building on the completion of the previous one, avoiding unnecessary delays or bottlenecks.
Progress Tracking
Gantt charts enable project managers to monitor the progress of individual tasks in real time. As tasks are done, the chart is updated to reflect their status, allowing teams to keep on track with the project’s objectives.
This capability quickly identifies delayed jobs and allows teams to change deadlines or resources to stay on track.
Task Summary
Task summary rolls several related tasks into one neat parent line on your Gantt chart. It lets you scan phases fast without drowning in tiny steps, while the detailed sub-tasks still sit right underneath when you need them.
With summaries in place, status check-ins feel quicker and calmer. For example, a “Development” summary can show overall progress even if it contains dozens of subtasks with different owners and dates.
Team Collaboration
Team collaboration means everyone works on the same shared Gantt chart, not separate versions. People can view updates, adjust dates, and add notes in one place, so tasks line up, and handoffs make sense across the timeline. No guessing now.
When priorities shift, collaboration keeps the schedule from feeling stuck. If testing slips by one day, the dev lead and product owner can react right away and adjust linked tasks together, instead of waiting for a long status call.
Document Sharing
Document sharing lets you attach files right to a task on the Gantt chart, so the work and its context stay together. Think briefs, mockups, or approval notes. This saves time because you stop hunting across tools. Everything stays nearby!!
Linking docs to tasks also helps everyone stay on the same version. For example, attach the latest proposal to “Client review,” so the team can comment on the right file, at the right time, without extra follow-ups or confusion later.
The Benefits of a Gantt Chart
Using a Gantt chart has various benefits for improving project management efficiency and effectiveness. It helps teams manage work, deadlines, and resources more efficiently. A Gantt chart allows project managers to keep things on schedule, minimize disruptions, and ensure timely project delivery.
Benefits include the following:
Enhanced Project Visibility
A Gantt chart gives project managers a clear and comprehensive perspective of all tasks and their deadlines, allowing them to track progress at a glance.
This greater visibility aids in the identification of bottlenecks, overlaps, and dependencies, allowing for more proactive modifications. It ensures that everyone participating in the project is informed of important milestones and deadlines.
Improved Time Management
A Gantt chart assists teams in focusing on the most important activities by breaking down a project into individual tasks with defined deadlines. It guarantees that time is allocated efficiently, which reduces the possibility of delays.
A graphic timeline allows teams to prioritize work and manage time more effectively, reducing wasted effort and fulfilling project deadlines.
Effective Resource Management
Gantt charts are useful for both task scheduling and resource management. Project managers allocate team members, equipment, or other resources to specific tasks to ensure efficient resource usage. They prevent resource overallocation or underallocation, ensuring that each activity receives the necessary resources to finish on time.
Streamlined Communication
Gantt charts are easy to grasp and visualize, which improves communication within a team and with external stakeholders. Everyone involved can instantly understand the project’s status and forthcoming deadlines. This enhances departmental coordination and reduces misconceptions, resulting in better communication and collaboration.
Better Risk Management
One significant advantage of using a Gantt chart is the ability to anticipate potential delays and hazards early in the project.
With a visual representation of job dependencies and schedules, project managers may identify areas where delays may arise and take corrective action before they affect the entire project. This proactive strategy reduces risks and keeps the project on pace.
Do Gantt Charts Have Disadvantages?
While Gantt charts are important project management tools, they have limits that can reduce their efficacy in certain situations. Although they provide a visual depiction of work and deadlines, they are not ideal for all projects. Here are some of the drawbacks and mistakes of utilizing Gantt charts:
Complexity in Large Projects
Gantt charts can get intimidating when dealing with large-scale projects with numerous tasks and dependencies.
As the number of activities grows, the chart can become congested and difficult to see, making it tough for project managers to keep track of everything. This might lead to confusion and mistakes, particularly if the project requires regular updates and revisions.
Limited Flexibility
In projects where activities change or evolve often, updating Gantt charts can be time-consuming. Because each task’s start and finish dates, as well as dependencies, must be manually modified, the process can be time-consuming and error-prone.
This lack of adaptability can impede project management, particularly in fast-paced or dynamic contexts.
Not Ideal for Every Project
Gantt charts are best suited for projects with well-defined tasks and deadlines. However, they are not necessarily appropriate for projects with a significant level of unpredictability or flexibility.
For example, in creative or agile projects, where activities are iterative and might change over time, Gantt charts may not give the level of detail required to properly manage the project.
Over-simplification
While Gantt charts provide a high-level picture of a project’s timeframe, they may oversimplify complex processes. The visual form of the chart frequently restricts its capacity to capture finer details, such as resource constraints or external dependencies that may affect a work.
This might result in a lack of depth in comprehending the complexities and nuances of project implementation, thereby affecting the project plan’s accuracy.
Assigning Work Without Checking Team Availability
A common mistake when utilizing a Gantt chart is assigning tasks without first ensuring whether team members are available to undertake them. This can result in overload and excessive expectations.
The solution is to always check the team’s availability before assigning work. Using scheduling tools or conducting regular team check-ins will help ensure that work is assigned appropriately and efficiently.
Overlooking Holidays and Time Off
Failure to account for holidays and time off in your Gantt chart might lead to unreasonable timetables. Without taking days off, you risk missing important project deadlines.
To avoid this, make sure that all scheduled time off, including public holidays and vacations, is included in the project timeline. This step will allow you to construct a more precise timeline and avoid unrealistic deadlines.
Forgetting to Ask for Feedback
Another mistake is to create or update a Gantt chart without first soliciting comments from the team. Missing this information can result in incomplete or incorrect job allocations.
To address this, always seek team comments while creating or amending the Gantt chart. Regular talks and team evaluations can assist in detecting concerns and ensuring that the project plan meets everyone’s expectations.
Setting it and Forgetting It
Treating the Gantt chart as a one-time setup and failing to update it regularly can result in out-of-date schedules. If you fail to amend the chart as tasks proceed, you risk missing deadlines or wasting resources.
The idea is to use the Gantt chart as a dynamic tool, updating it on a frequent basis. Set up periodic reviews to account for any changes in the project and ensure it appropriately reflects its current status.
What Is a Gantt Chart Used For in Projects?
A Gantt chart is used in projects to show how work unfolds over time in a clear and structured way. It helps teams understand task order, timing, and flow, making complex projects easier to plan, follow, and manage from start to finish.
Below are common ways Gantt charts are used across different project types:
- Event planning coordination: Gantt charts help plan event tasks like venue booking, vendor setup, and rehearsals in one timeline. They ensure deadlines align before the event date and help organizers avoid last-minute conflicts or missed preparations.
- Construction scheduling: In construction projects, Gantt charts map phases such as design, procurement, and on-site work. They help teams track dependencies between tasks, manage long timelines, and reduce delays caused by overlapping or late activities.
- Project execution control: Gantt charts are used to plan and monitor daily project work. They clarify task order, deadlines, and progress, helping managers keep execution aligned with the original plan and adjust schedules when changes occur.
- Portfolio level oversight: For project portfolio management, Gantt charts compare timelines across multiple projects. They help leaders balance priorities, spot resource conflicts, and align different initiatives with broader business objectives.
- Software development project: In software engineering, Gantt charts organize stages like development, testing, and deployment. They help teams coordinate releases, manage sprint timelines, and understand how delays in one task affect others.
- Manufacturing workflow project: Gantt charts support manufacturing by mapping production steps, machine usage, and delivery schedules. They help ensure smooth workflows, reduce idle time, and keep production aligned with demand targets.
Examples of Gantt Chart
A Gantt chart example helps readers understand how timelines, tasks, and dependencies look in real project scenarios. By seeing practical use cases, teams can better imagine how this tool supports planning, coordination, and execution across industries. Clearly and simply.
Below are common Gantt chart examples used in different types of projects:
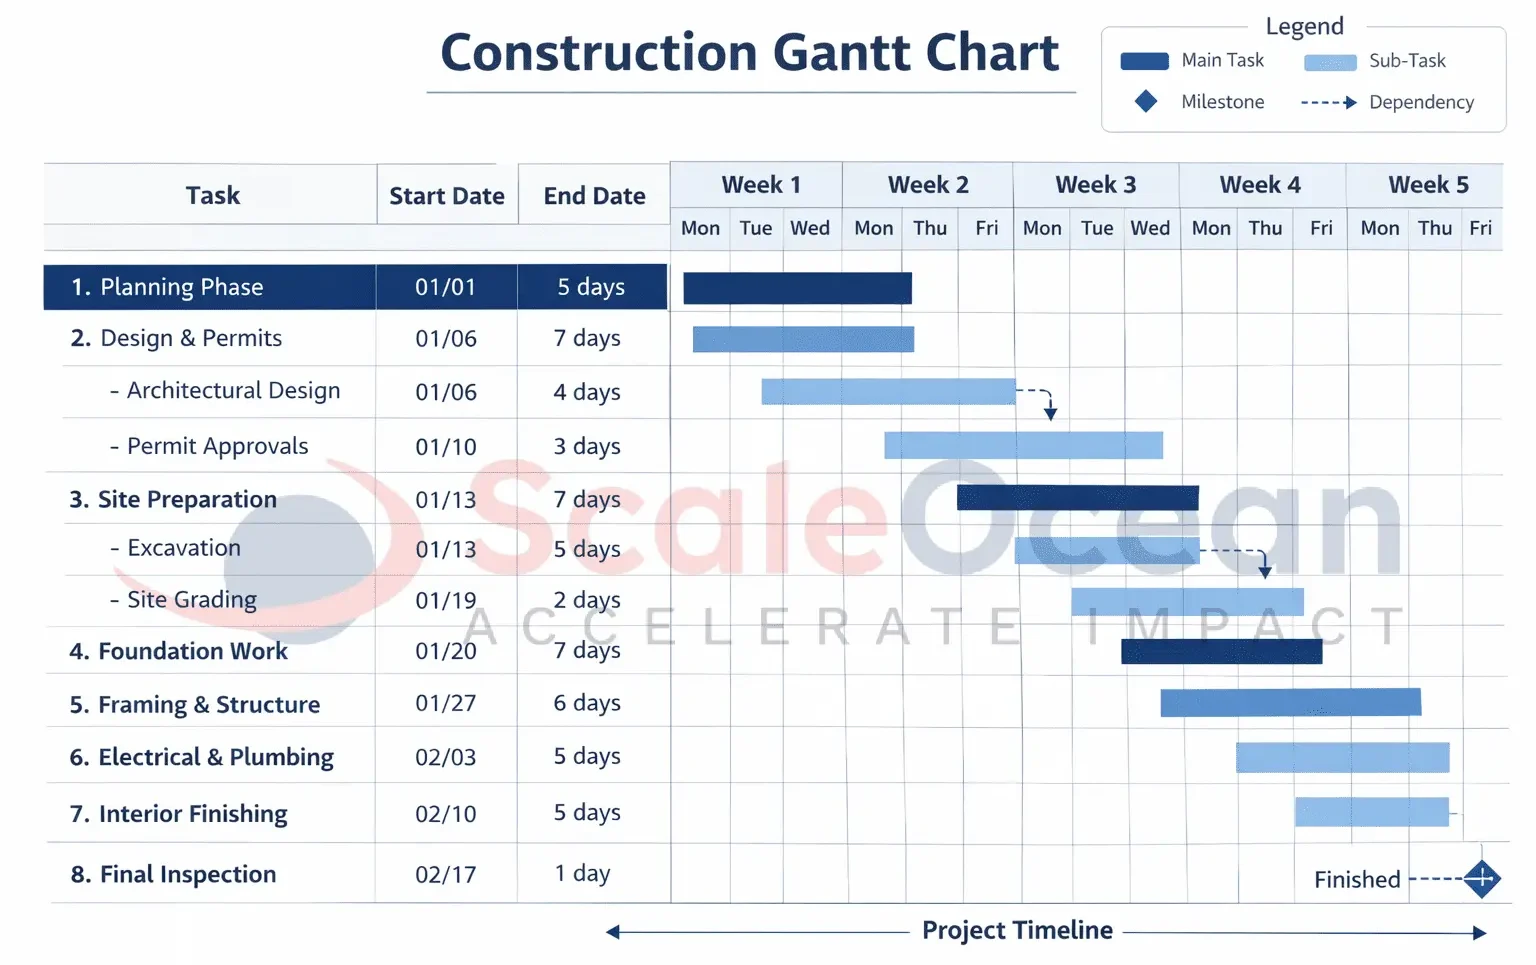
Construction Gantt Chart
A construction Gantt chart maps activities such as design, material procurement, site preparation, and building work in one timeline. It shows task order and dependencies, helping teams coordinate contractors and avoid clashes on site.
By visualizing long project phases, this chart helps managers track progress and respond to delays early. For example, if material delivery slips, related tasks can be rescheduled before it impacts the overall completion date.
Here are the gantt chart example of a construction project:
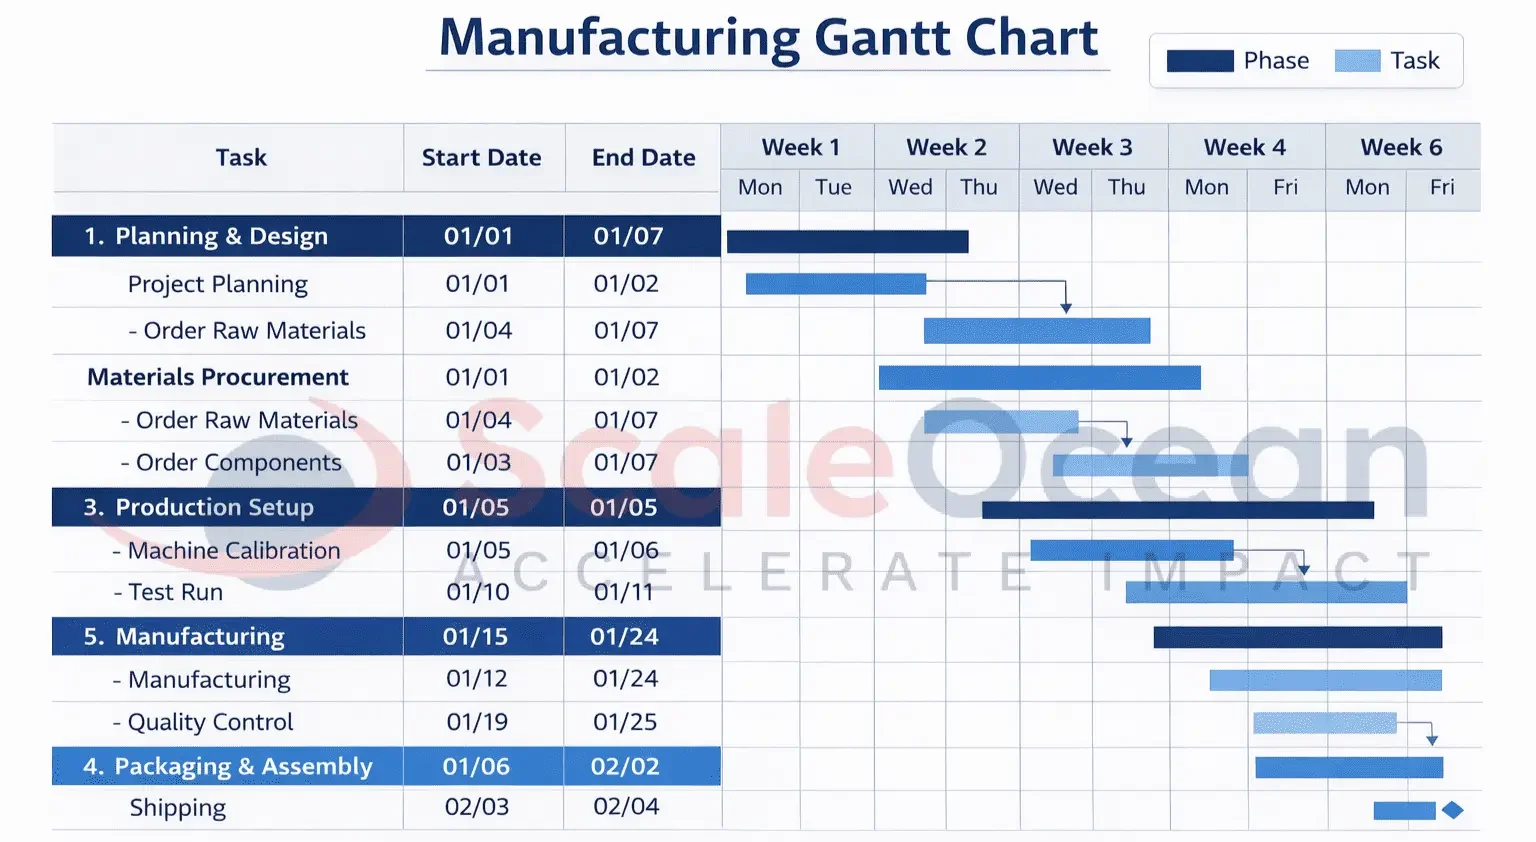
Manufacturing Gantt Chart
A manufacturing Gantt chart outlines production stages, machine usage, and delivery schedules. It helps factories plan workflows clearly, ensuring each step happens in the right order without disrupting downstream processes.
With this chart, planners can spot bottlenecks and idle time quickly. For example, overlapping machine schedules become visible, allowing adjustments that keep production running smoothly and aligned with demand targets.
Here are the gantt chart example of a manufacturing project:
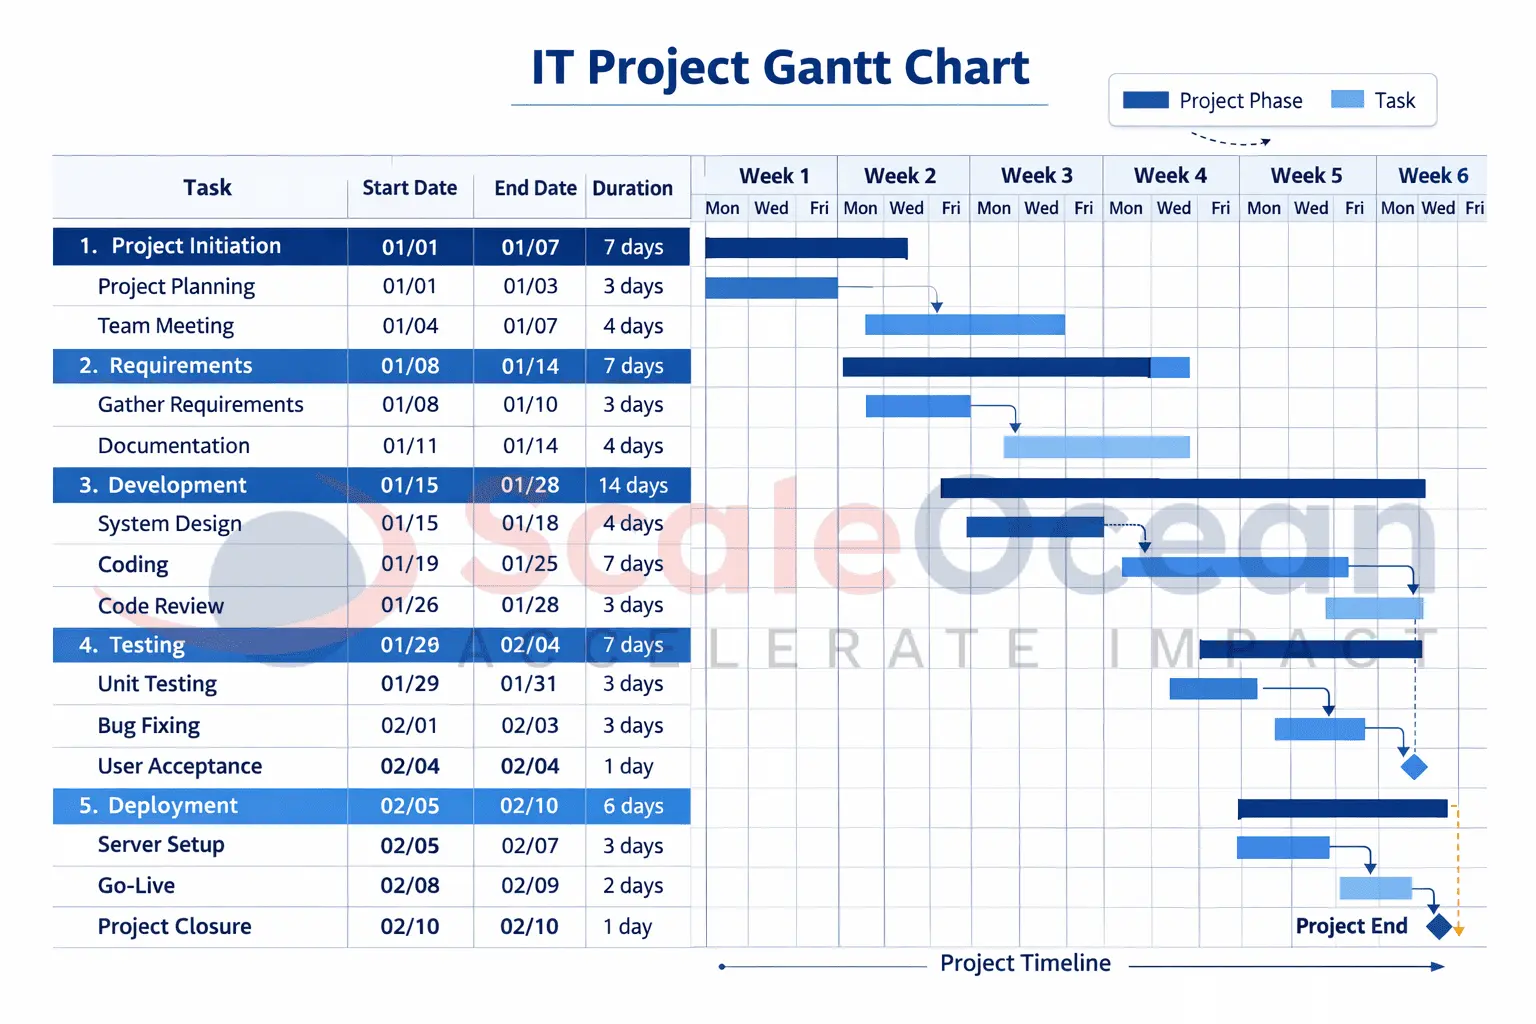
IT Project Gantt Chart
An IT project Gantt chart organizes phases like requirement analysis, development, testing, and deployment. It helps teams see how technical tasks connect and when handoffs should happen across roles.
This example is useful for managing change and scope updates. If testing takes longer than planned, the chart shows which releases are affected, helping teams reset timelines without losing overall project direction.
Here are the gantt chart example of an IT project:
When to Use a Gantt Chart for Your Project
A Gantt chart is most useful when your project involves multiple tasks that must follow a clear timeline. It helps you see how work progresses over time, what must be completed first, and how each activity contributes to the outcome or project objective.
You can rely on a Gantt chart when you want to turn a broad plan into a structured execution roadmap. According to CSC Singapore, on a large-scale energy infrastructure project, structured communication and coordination among stakeholders through tools like Gantt charts supported timely decisions and strong outcomes.
A Gantt chart is especially effective when you need to:
- Define the scope of work: It outlines all activities involved in the project and breaks them into manageable tasks, making responsibilities and workload distribution clearer.
- Set and manage timelines: It displays start dates, end dates, and durations, helping you understand how long each task takes and how delays affect the schedule.
- Understand task relationships: It visualizes task order and dependencies, which is critical when one task cannot start until another is completed.
- Track execution and milestones: It helps you follow progress in real time and recognize key checkpoints, ensuring the project stays aligned with its planned direction.
How to Make a Gantt Chart

Creating a Gantt chart is a step-by-step approach for organizing and visualizing your project from beginning to end. It’s a wonderful approach to keep track of projects, deadlines, and dependencies, ensuring that everything gets completed on time.
Creating a Gantt chart is an important component of project management since it allows you to visualize timeframes and track progress effectively. Follow these ten detailed steps to make a Gantt chart that will keep your projects organized and on track:
1. Define Project Scope
Begin by clearly stating your project’s objectives, goals, and deliverables. This will provide you with a high-level overview of what needs to be done, ensuring that all stakeholders are clear on the project’s aim and end goals.
A well-defined project scope sets the foundation for the entire planning process and helps manage expectations.
2. Break Down the Tasks
Identify all tasks that must be accomplished in order to achieve the project’s objectives. Break down larger goals into smaller, more manageable activities that can be easily specified, allocated, and finished.
This ensures that no details of the project are neglected. Smaller tasks make it easier to track progress and maintain focus on specific milestones.
3. Set Task Durations
Set a realistic start and finish date for each job. Consider the extent of the task, team availability, and probable barriers. Setting adequate timeframes helps to avoid delays and keeps the project on track.
Adjusting task durations as needed can also help accommodate unforeseen challenges without compromising the project timeline.
4. Determine Task Dependencies
Identify which tasks need to be completed before others can begin. Determining dependencies helps eliminate scheduling conflicts and ensures that you arrange the workflow logically, which reduces bottlenecks throughout the project.
Understanding dependencies also helps to prioritize critical tasks and allocate resources efficiently.
5. Choose a Gantt Chart Template
Using a Gantt chart template from accessible software or online resources might make the creation process easier. Templates are intended to make data entry easier, allowing you to organize tasks, establish deadlines, and measure progress more efficiently.
Using a template saves time and simplifies the process of manually developing a Gantt chart, enabling you to focus on properly managing your project.
6. Enter Task Information
Enter the tasks and their dates into your Gantt chart. To lay the groundwork for your project’s timeline, make sure that each task is appropriately described with accurate facts such as start and end dates, as well as duration.
This ensures that all stakeholders have a clear understanding of the schedule and their respective responsibilities.
7. Add Dependencies
Link tasks with dependencies to ensure the process is correct. This will visually show how tasks are related and which must be finished before others can begin, resulting in a more precise project timeline.
Identifying dependencies early on will help prevent delays caused by missed or unanticipated task sequences.
8. Assign Resources
Assign resources such as people, equipment, and supplies to each task. By allocating resources, you can ensure that activities have the necessary support to be completed on schedule and minimize resource shortages during project implementation.
Proper resource allocation also helps to avoid overburdening any single team member or resource.
9. Track Progress
As the project proceeds, mark completed tasks and change timeframes accordingly. Regularly updating the chart helps you to track the status of each task and make adjustments to stay on track, avoiding project delays.
Consistent monitoring provides transparency, keeping all team members informed about the project’s current status.
10. Review and Adjust
Regularly examine the Gantt chart to account for any delays or changes in project scope. Revisiting the chart ensures that it remains relevant throughout the project’s lifecycle, allowing you to manage unexpected obstacles and keep the project on track.
Making adjustments proactively helps prevent issues from escalating and affecting the overall project timeline.
How to Make a Gantt Chart in Excel
Creating a Gantt chart in Excel is an extremely effective approach to managing your project’s timeline and tasks. Excel provides all the tools you need to build a visual project schedule and tailor it to the specific needs of your project.
By integrating it with tools like a timesheet, you can efficiently track work hours, monitor progress, and ensure that tasks are completed on time. Using the techniques below, you can create an accurate and organized Gantt chart to track progress, allocate resources, and meet deadlines.
1. Create a table
To begin, build a table with the first column listing all project-related tasks. In the following columns, put the start date and length of each task.
The start date shows when the task will begin, and the length shows how long the task will last. This data serves as the foundation for your Gantt chart and helps create the visual timeline.
2. Insert a bar chart
Next, highlight the data in the start date and duration columns, then use the Excel toolbar to insert a stacked bar chart.
The stacked bar chart will provide an overview of the project’s timetable, with each bar representing a task. The length of the bar indicates the task’s duration, while its position on the horizontal axis represents the start date.
3. Format the chart
After placing the bar chart, format it to improve clarity and usability. Remove any extraneous chart features, such as the legend, gridlines, and title.
Adjust the bars so that they correspond to the timeline and task durations precisely. You can also vary the color of the bars to distinguish between different activities or phases of the project.
4. Add dependencies
Many projects have tasks that are contingent on the fulfillment of others. To visually demonstrate these dependencies, utilize Excel’s drawing capabilities to manually create arrows connecting related operations.
This stage will help to explain which tasks must be accomplished before others can begin, resulting in a better knowledge of the project workflow.
5. Update the chart
As the project proceeds, it is critical to keep the Gantt chart updated to reflect changes in timeframes, job completion, or delays. Change the duration and start dates of tasks as necessary, and alter the bar lengths accordingly.
Keep the chart updated to ensure that it continues to be an accurate and effective tool for tracking project progress and meeting deadlines.
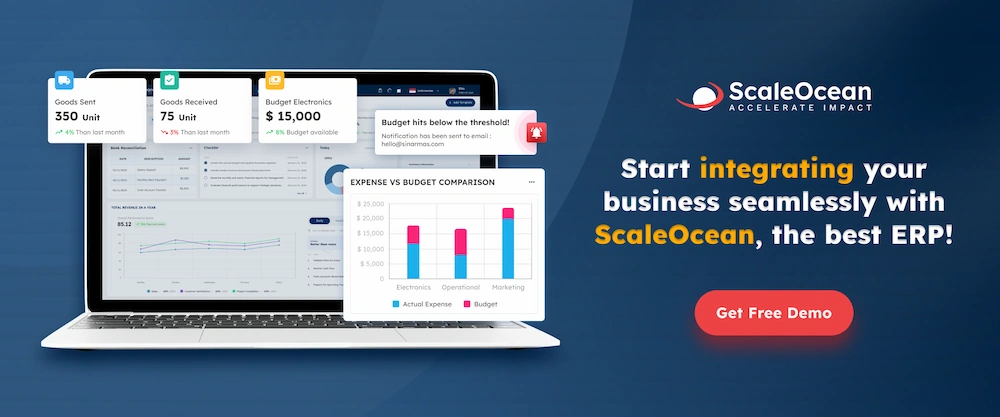
Manage and Create Automatic Gantt Charts with ScaleOcean HRIS Software
![]()
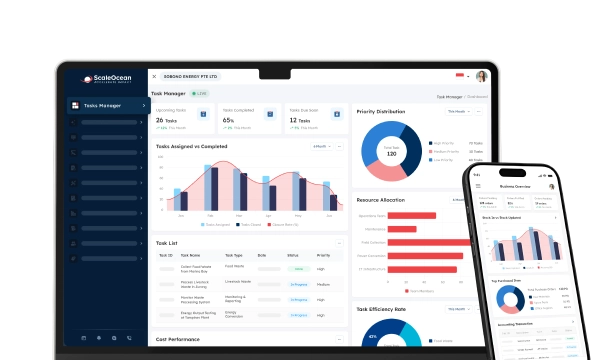
ScaleOcean HRIS (Human Resource Information System) is a robust program that combines project management capabilities to assist firms in managing projects more effectively. One of ScaleOcean’s primary features is its Gantt Chart capabilities, which enable enterprises to easily see and track project timeframes.
Gantt charts help businesses track progress in real time, optimize resource allocation, and ensure teams meet deadlines without overburdening members, all while supporting efficient human resource management.
This tool not only simplifies project management but also boosts overall productivity by giving clear visual representations of project milestones and deadlines. ScaleOcean provides an HRIS solution that allows enterprises to test the software’s capabilities, including the Gantt Chart tool.
Furthermore, the CTC (Cost to Company) award can assist enterprises in implementing this solution. If you want to learn more about how ScaleOcean may help you streamline your project management procedures, request a free demo today. The following are the key features of ScaleOcean’s software.
- Integrated Project Management with Gantt Chart: ScaleOcean features project management tools that allow users to plan and manage projects comprehensively with visualizations such as Gantt Charts.
- Real-Time Project Progress Tracking: With the Gantt Chart feature, project managers can track the progress of each phase of a project in real-time, providing full visibility of the project’s status.
- Resource Optimization: The Gantt Chart in ScaleOcean also helps optimize the use of resources, including labor, equipment, and materials, by efficiently managing resource allocation.
- Automated Alerts and Notifications: The system automatically sends notifications if a project is nearing its budget limit or deadlines.
- Comprehensive and Customizable Reports: ScaleOcean provides detailed project reports on progress, costs, and timelines.
Conclusion
Creating a Gantt chart is an important tool for successful project management since it allows organizations to efficiently plan, track progress, and allocate resources. By following the procedures explained in this article, you can simply incorporate a Gantt chart into your workflow and ensure that your projects are finished on time and under budget.
Whether you’re leading a small team or directing a large-scale project, this tool provides the clarity required for successful execution.
ScaleOcean’s HRIS software includes integrated capabilities such as Gantt charts, real-time tracking, and resource optimization to help enterprises further streamline their project management process.
These features are intended to make project management easier, improve efficiency, and increase visibility across teams. To understand how ScaleOcean can help your company, get a free demo today and learn how our platform can simplify project management and increase overall efficiency.
FAQ:
1. What is the Gantt chart used for?
A Gantt chart is a tool used in project management to help teams organize tasks, monitor project timelines, manage resources, and ensure deadlines are met. It visually displays tasks as horizontal bars along a timeline, showing when each task starts and ends, providing an overview of the project’s progress.
2. Can I do a Gantt chart in Excel?
Yes, you can create a Gantt chart in Excel by using a stacked bar chart, adjusting it to represent tasks, start dates, and durations. Alternatively, you can find downloadable Excel templates that simplify the creation of Gantt charts.
3. What are the five components of a chart?
Parts of a Chart:
1. Title.
2. The Horizontal and Vertical Axes.
3. Data Series.
4. Key.
4. What is the full meaning of Gantt?
Gantt comes from Henry Gantt, the engineer who introduced an early time-based chart for managing projects. Over time, his name became the label for this method. A Gantt chart is a horizontal bar chart that displays project tasks across a timeline.