




Inventory forecasting refers to a process to estimate how much stock a business will need in the future based on analytical evaluations. Back then, warehouse staff only relied on guesswork to fill-up the stock for goods which were usually inaccurate.
To solve this problem, modern inventory management uses an effective approach to forecasts based on historical sales or other relevant factors. This article guides you through the inventory forecasting process to maintain optimal stock levels.
 Key Takeaways
- Inventory forecasting helps businesses estimate future stock demand using historical sales, current inventory, trends, seasonality, and other relevant factors.
- Accurate inventory forecasting can reduce stockouts, lower holding costs, minimize dead stock and waste, and improve cash flow.
- Businesses can use different forecasting methods, including quantitative, qualitative, trend, and graphical forecasting, depending on demand patterns.
- ScaleOcean Atlas can support inventory forecasting by centralizing inventory data, tracking stock movements, and providing forecasting capabilities.
1. What is Inventory Forecasting?
Inventory forecasting is the process of predicting future inventory demand to determine how much stock a business may need. The forecast typically uses historical sales data or current inventory levels so it serves more reliable data.
For example, a Philippine grocery retailer may review previous December sales to estimate how much Christmas-related inventory it should prepare for the upcoming holiday season. This offers accurate information to stock-up so the goods won’t overstock or understock for customers to buy.
Inventory forecasting does not mean predicting demand with 100% accuracy. Instead, its purpose is to give businesses a reasonable estimate that can support better purchasing and inventory decisions. A forecast might use average monthly sales:
Forecasted Demand = Total Historical Demand/Number of Periods
For example, if a business sold 1,200 units over the last three months: 1,200/3 = 400 units per month. The business could use 400 units as a basic starting forecast, then adjust it for expected promotions, seasonality, market changes, or other factors.
Moreover, it is also supported by a study published in IJSAT, highlighting MSMEs at Pagadian City’s C3 Mall evaluated sales forecasting methods like moving averages, linear regression, and Holt-Winters smoothing to help inventory stocks.
The study found that integrating forecasting capabilities into inventory systems can support inventory monitoring and data-driven decision-making, which resulted in more reliable preparations for the peak seasons.
2. Inventory Forecasting vs. Stock Replenishment
Inventory forecasting and stock replenishment are related, but they are not the same process. Forecast is more likely related to estimate future demand, while replenishment determines how much inventory should be ordered. Here are the differences:
| Inventory Forecasting | Stock Replenishment |
|---|---|
|
Estimates future demand |
Determines when to restock |
|
Looks at historical and expected demand |
Looks at current stock and inventory thresholds |
|
Supports purchasing and production planning |
Triggers purchasing or stock transfers |
|
Answers “How much might we need?” |
Answers “When and how much should we replenish?” |
In practice, businesses benefit from using both. A forecast without replenishment planning may remain only a number on a spreadsheet, while replenishment without a reliable forecast can result in excessive or insufficient stock.
3. Why is Inventory Forecasting Important?
Accurate forecasting allows businesses to make inventory decisions before demand actually occurs. This can improve product availability while reducing the financial and operational problems associated with excess inventory. Here are some benefits of it:
a. Fewer Stockouts and Lost Sales
For an online seller like on TikTok or Shopee preparing for a 12.12 campaign may experience a sharp increase in orders for popular products. The inventory forecast helps identify required stock to avoid run out stocks during the campaign.
b. Lower Holding and Storage Costs
Another benefit of accurate forecasts is to help businesses avoid ordering significantly more inventory than they are likely to sell. Because keeping too much inventory can increase warehouse, handling, deterioration, and other carrying costs.
c. Less Dead Stock and Waste
Dead stock refers to inventory that remains unsold for an extended period. It’s because poor forecasting can contribute to it when businesses purchase stocks based on assumptions. Moreover, an accurate forecast will help avoid dead stock and waste.
d. Better Cash Flow and Working Capital
In addition, better forecasts also contribute to easier cash flow because inventory ties up business capital until products are sold. If too much cash is invested in slow-moving stock, a business may have less working capital. It helps businesses balance inventory availability with the amount of capital committed to stock.

4. The 4 Types of Inventory Forecasting
Businesses can use different forecasting approaches depending on the amount of historical data available, the type of products being sold, and the complexity of demand patterns. Here are the types of inventory forecasting:
a. Quantitative Forecasting
Quantitative forecasting uses numerical and historical data to estimate future demand. Common methods include moving average, weighted moving average, exponential smoothing, regression analysis, and time-series forecasting
This approach is useful for businesses with reliable sales records because the forecast is based on measurable demand patterns. For example, a distributor can analyze several months of sales data to estimate expected demand for the following month.
b. Qualitative Forecasting
Qualitative forecasting relies more heavily on human judgment and market knowledge. It can be useful when historical data is limited, such as when launching a new product or entering a new market. Sales teams or business owners can contribute their knowledge when historical data alone is insufficient.
c. Trend Forecasting
Trend forecasting identifies whether demand is generally increasing, decreasing, or remaining stable over time. However, businesses should avoid simply extending an upward trend indefinitely.
Several factors to evaluate are promotions or price changes that can cause the pattern to change. For instance, if sales of a particular skincare product increased consistently over the past six months, a business may expect demand to continue rising.
d. Graphical Forecasting
Graphical forecasting uses charts or visual representations of historical data to identify patterns. Further, a sales graph can reveal increasing demand or unusual sales fluctuations, for businesses that are not yet using advanced forecasting software, visual analysis can be a practical starting point.
 Also Read: Top 13 Inventory Forecasting Software in the Philippines (2026)
5. Inventory Forecasting Formulas
There is no single inventory forecasting formula that works for every business. Different formulas answer different inventory planning questions. Below here are some of the formulas of inventory forecast to optimize stock levels in warehouse:
a. Lead Time Demand
Lead time demand estimates how much inventory a business is expected to sell while waiting for a replenishment order to arrive. It is particularly important when suppliers do not deliver immediately after an order is placed. Formula:
Lead Time Demand = Average Daily Demand × Lead Time in Days
For example, suppose a distributor in Cebu sells an average of 50 units per day, while its supplier typically takes 7 days to deliver an order. The calculation is 50 × 7 = 350 units. The business may therefore need approximately 350 units to cover expected demand during the supplier’s lead time.
b. Reorder Point
The reorder point (ROP) determines the inventory level at which a business should place a new replenishment order. The objective is to trigger purchasing early enough for new stock to arrive before existing inventory runs out. The formula is:
Reorder Point = Lead Time Demand + Safety Stock
Using the previous example, if lead time demand is 350 units and safety stock is 100 units, the calculation is 350 + 100 = 450 units. The business could set its reorder point at 450 units. When available inventory reaches approximately 450 units, the purchasing team should consider placing a replenishment order.
c. Safety Stock
Safety stock is additional inventory kept as a buffer against unexpected changes in demand or supply. It can help protect businesses from stockouts when customers purchase more than expected or suppliers take longer to deliver. The formula is:
Safety Stock = Maximum Expected Demand During Lead Time – Average Expected Demand During Lead Time
For example, suppose a retailer normally expects to sell 350 units during its supplier’s lead time but could sell as many as 450 units when demand is unusually high, 450 – 350 = 100 units. Further, the business would therefore maintain approximately 100 units of safety stock under this simplified approach.
d. Inventory Turnover
Inventory turnover measures how efficiently inventory is sold and replaced over a period. Although it does not directly forecast future demand, it is a useful supporting metric for evaluating whether current inventory levels are appropriate relative to sales.
Inventory Turnover = Cost of Goods Sold (COGS)/Average Inventory
Average inventory can be calculated as:
Average Inventory = (Beginning Inventory + Ending Inventory)/2
For example, suppose a Philippine retailer has:
- Annual COGS= ₱2,400,000
- Beginning inventory= ₱500,000
- Ending inventory= ₱700,000
First, calculate average inventory: (₱500,000 + ₱700,000)/2 = ₱600,000
Then calculate inventory turnover: ₱2,400,000/₱600,000 = 4x
This means the business turned over its average inventory approximately four times during the year. A higher turnover ratio can indicate that inventory is selling quickly, while a low turnover ratio may indicate slow-moving inventory, excess stock, or weak demand.
e. Seasonal Index
A seasonal index measures how demand during a particular period compares with the average demand. It helps businesses adjust forecasts when sales regularly increase or decrease during certain months, holidays, or events. The formula is:
Seasonal Index = Period Demand/Average Demand
To make it easier to understand, for example, suppose a retailer’s average monthly sales are 1,000 units, while its December sales historically average 1,500 units: 1,500/1,000 = 1.5.
A seasonal index of 1.5 suggests that December demand is approximately 50% higher than the average month. Businesses can use historical seasonal indexes to adjust future forecasts rather than treating every month as having the same demand.
6. How to Do Inventory Forecasting: 5 Steps

Knowing how to do inventory forecasting does not necessarily require sophisticated software. A business can start with clean historical data and a structured process. Below are the five steps to do inventory forecasting:
a. Choose Your Forecast Period
The first step is to determine how far into the future you need to forecast. The appropriate period depends on your business model and supplier lead times. For example, if you have a retail business, daily forecasts may be suitable to optimize your business.
Also, consider your supplier lead time when selecting the forecast period. A business importing products from overseas may need a longer planning horizon than a local retailer purchasing from a nearby supplier.
b. Gather and Clean Historical Data
Secondly, you can collect relevant historical information such as, sales quantities, sales dates, product SKUs, and purchase orders. After that, you can clean the historical data by filtering the valuable information.
For example, if a product recorded zero sales for one week because it was out of stock, that does not necessarily mean customer demand was zero. Treating stockout periods as normal demand can make future forecasts artificially low.
c. Identify Trends and Seasonality
The third step is to look for recurring patterns in your data. To make it easier, ask questions such as, ‘do sales increase during payday periods?’, ‘which products sell more during Christmas?’ or ‘are there products that consistently slow down?’
Moreover, this step is particularly important in the Philippines, where consumer demand can vary considerably around holidays, shopping campaigns, and seasonal events.
d. Apply a Method and Calculate
Choose a forecasting method that matches your data. For a small business with relatively stable demand, a moving average may be sufficient. Businesses with stronger seasonal patterns may consider weighted or seasonal methods.
e. Review and Adjust
Last but not least, forecasts should not be treated as permanent numbers. Compare actual sales against forecasts and investigate significant differences. For example, if the forecast predicted 1,000 units but actual demand reached 1,400 units, determine why.
The difference could have resulted from a promotion, competitor stockout, seasonal event, or other external factor. Therefore, regularly reviewing forecast accuracy helps businesses improve future planning.
7. Some Factors to Keep in Mind for Inventory Forecasting in the Philippines
Philippine businesses often face demand and supply conditions that can make inventory planning more complex. Incorporating local patterns into your forecast can make the result more useful. Here are some factors to consider when forecasting for inventory:
a. Payday Cycles and Fortnightly Demand
Consumer spending may change around common salary periods. Some businesses may experience stronger demand immediately after payday, particularly in retail, grocery, dining, and e-commerce.
Instead of relying only on monthly averages, businesses can analyze daily or weekly sales to determine whether their products show recurring payday-related patterns. It’s also related to a pay day sale that is held by several e-commerce sites like TikTok or Shopee.
b. The Ber-Months and Christmas Season
The September-to-December period is an important consideration for many Philippine businesses. Because within these months, there are several holiday seasons that come up. Historical sales from previous ber-months can help businesses determine when demand starts increasing, and which products require additional inventory.
c. Double Dates 12.12 Campaign Demand Spikes
Online shopping campaigns such as 11.11 or 12.12 can create significant short-term demand spikes. A monthly average may not accurately reflect these events. Instead, e-commerce businesses should compare sales during previous campaign periods and account for promotions.
d. Typhoon Season and Lead Time Disruption
Weather conditions can impact both supply and demand. Typhoons and heavy rain often disrupt transport routes, port operations, and delivery schedules. Consequently, businesses relying on inter-island distribution should add lead-time buffers and factor inventory arrival constraints, not just demand, into their forecasts.
8. Best Practices for Accurate Inventory Forecasting
A good forecasting process is not only about selecting the right formula. The quality of the underlying data and the way forecasts are reviewed can have an equally significant impact. Consider the following practices:
- Use Reliable Sales Data: Keep product, quantity, date, and transaction records accurate and consistent.
- Separate Stockouts from Low Demand: Zero sales may mean the product was unavailable, not that customers did not want it.
- Account for Promotions: A temporary sales spike caused by a discount should not automatically become the baseline forecast.
- Track Seasonality: Compare the same periods across previous years where possible.
- Segment Products: Fast-moving products may require more frequent forecasting than slow-moving SKUs.
- Consider Supplier Lead Times: Demand forecasts should be connected to realistic replenishment schedules.
- Monitor Forecast Accuracy: Compare forecasted demand with actual sales and investigate large deviations.
- Update Forecasts Regularly: Market conditions can change, so forecasts should evolve with new data.
- Connect Forecasting with Inventory Data: Purchasing, warehouse, sales, and inventory teams should work from consistent information.
- Use Automation as the Business Grows: Spreadsheets can work for smaller product ranges, but larger SKU counts make manual forecasting increasingly difficult.
9. ScaleOcean Atlas Accelerates Inventory Forecasting Efficiency
Another thing to understand is that it’s also important to consider adopting software for enhancing inventory forecasting processes. As the number of SKUs or warehouses manually calculating forecasts can become time-consuming and difficult to maintain.
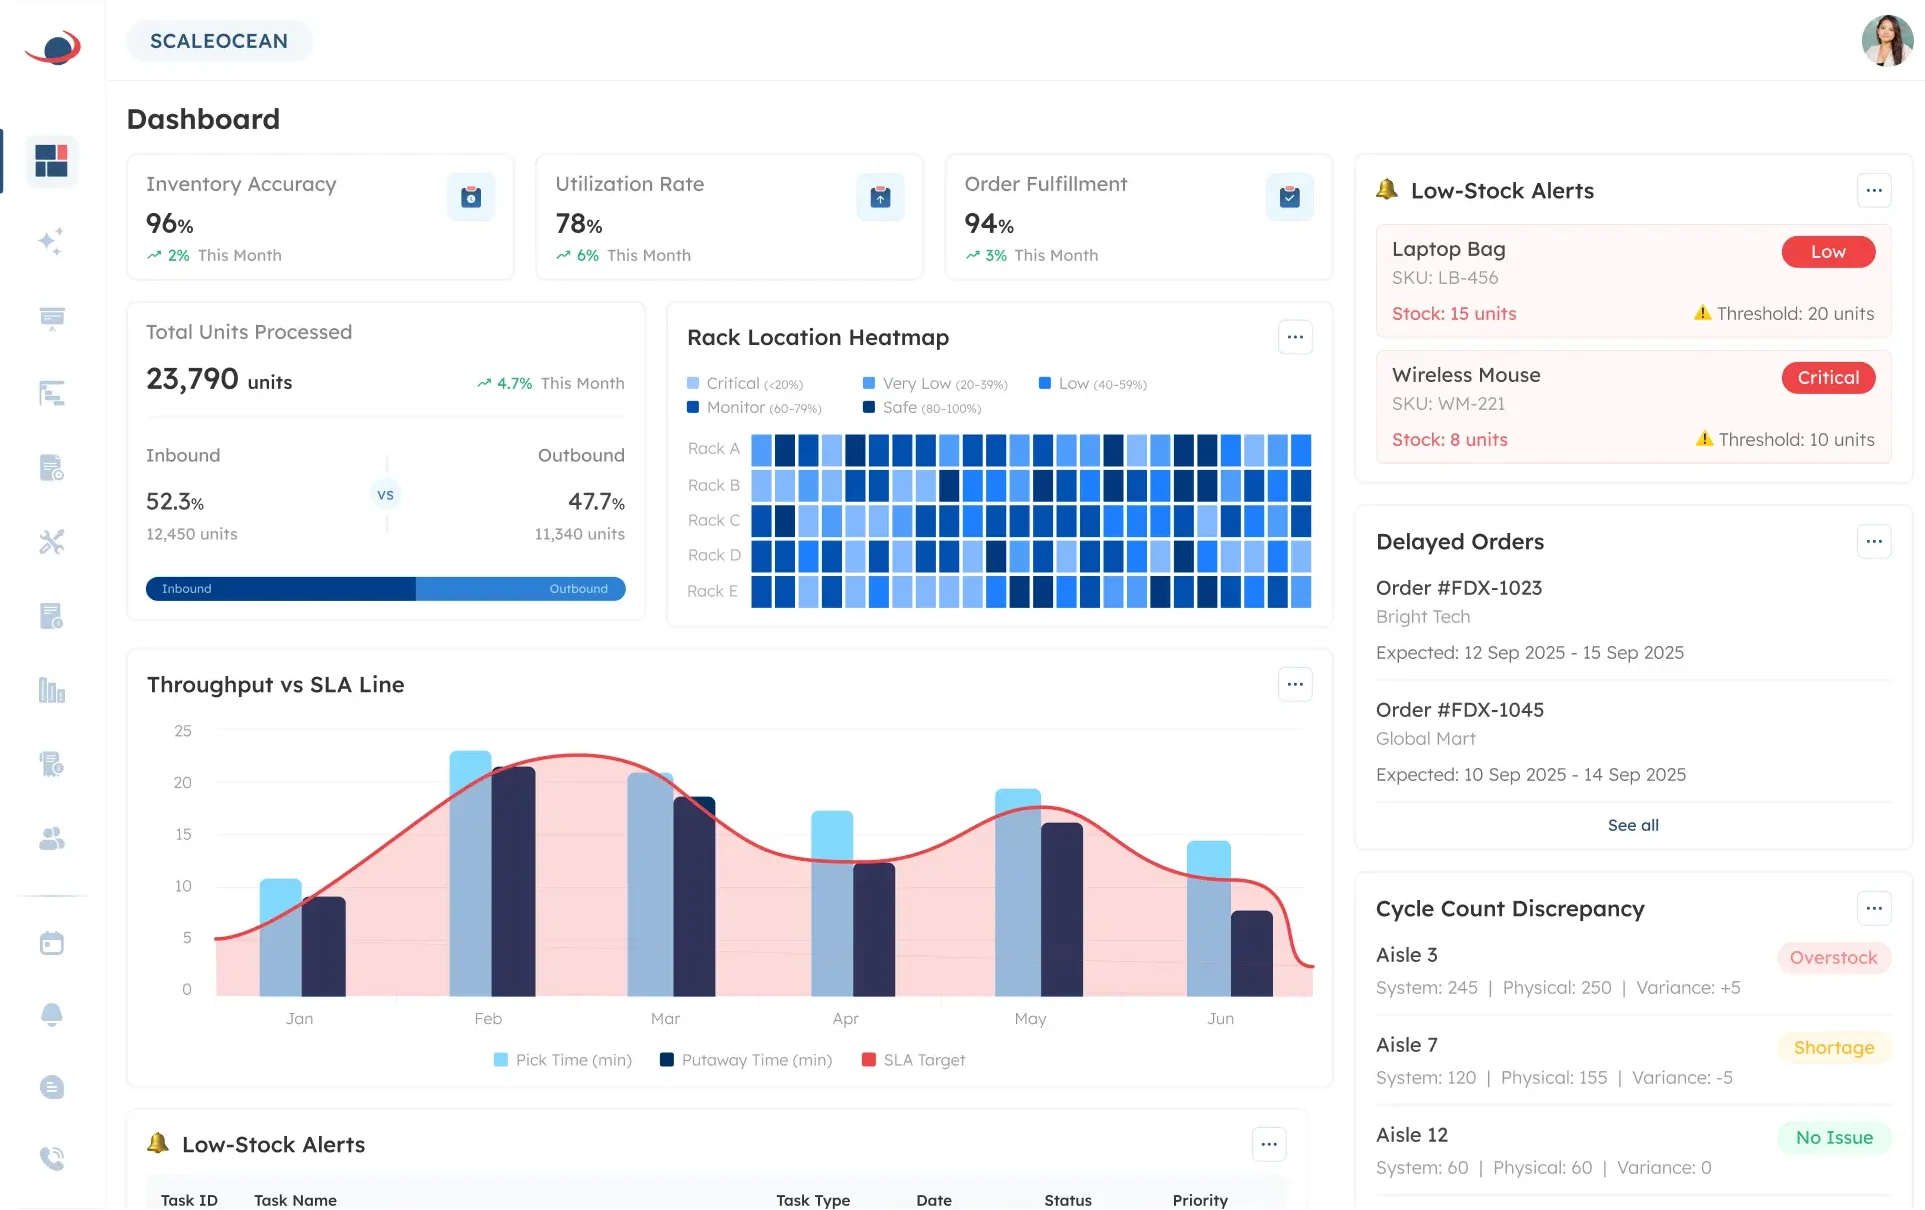
ScaleOcean Atlas provides an inventory module with inventory forecasting capabilities that can help businesses use historical inventory and sales information to support future stock planning.
Moreover, this ability also includes inventory forecasting, real-time inventory tracking, barcode management, low-stock notifications, stock adjustments, and lot and serial number tracking.
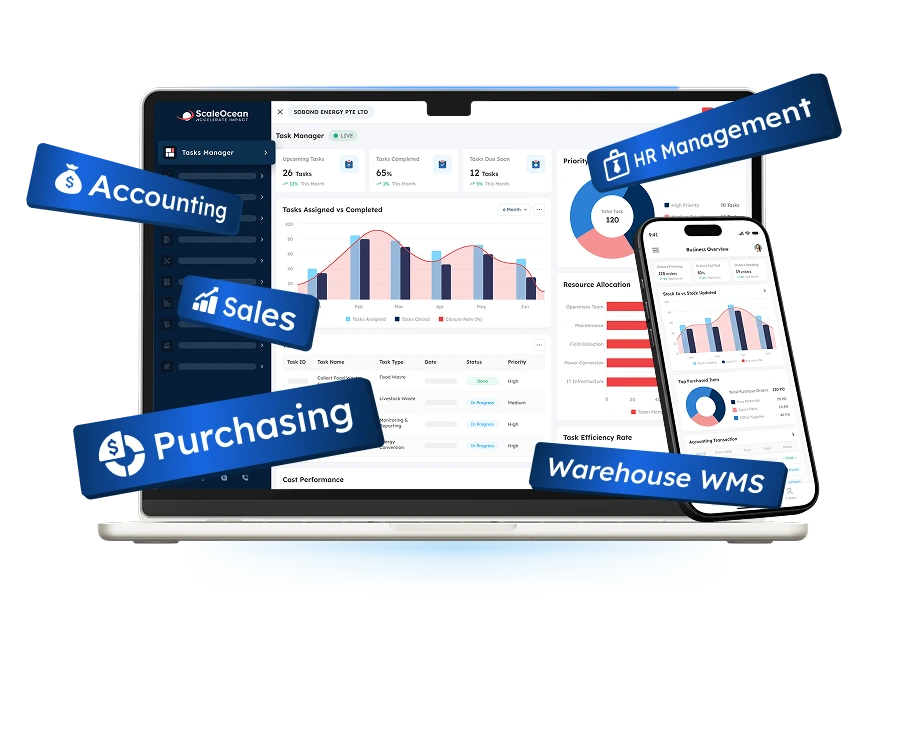
Instead of maintaining separate spreadsheets for sales, purchasing, and warehouse data, businesses can connect inventory activities in one system. This makes it easier for teams to see current stock conditions and identify replenishment.
Schedule a consultation our experts today to see how ScaleOcean Atlas optimizes inventory forecasting with the following features:
- Real-Time Inventory Tracking: Up-to-date view of stock levels and inventory movements across warehouses to provide more reliable data for forecasting and replenishment planning.
- Inventory Forecasting: Analyzing historical inventory and demand patterns to estimate future stock requirements and help maintain inventory levels that match expected demand.
- Low-Stock Alerts: Set minimum stock thresholds and receive notifications when inventory approaches critical levels, allowing teams to respond before potential stockouts occur.
- Stock Movement Monitoring: Track inbound, outbound, and transferred inventory to identify movement patterns and improve the accuracy of inventory planning.
- Barcode Management: Use barcode scanning to capture inventory transactions more accurately, creating cleaner and more consistent data for forecasting and stock analysis.
- Lot & Serial Number Tracking: Monitor inventory by lot or serial number to improve product traceability and support more precise planning for items with specific inventory requirements.
- Inventory-Purchasing Integration: Connect inventory information with purchasing activities to support timely replenishment based on current stock levels and anticipated inventory needs.
10. In Conclusion
Inventory forecasting helps businesses estimate future demand for better purchasing, replenishment, and stock management. Instead of reacting to stock issues late, companies can use historical data, trends, seasonality, and lead times to plan ahead effectively.
To start, collect reliable data, identify demand patterns, select a forecasting method, calculate expected demand, and review results regularly. Formulas like lead time demand, reorder point, safety stock, and inventory turnover further strengthen your planning.
In the Philippines, consider local factors like payday cycles, ber-months, 12.12 sales, and typhoon disruptions. As inventory data grows more complex, an integrated management system makes forecasting and replenishment far easier to manage.
ScaleOcean Atlas centralizes inventory data, tracks stock movements, supports forecasting, and connects planning directly with purchasing and warehouse operations.
To improve your inventory planning, schedule a consultation with ScaleOcean to explore a solution tailored to your operational needs.
FAQ:
1. How do you forecast inventory?
Forecast inventory by reviewing historical sales, expected demand, supplier lead times, and safety stock. You can use methods such as moving averages or formulas like reorder points to estimate when and how much stock you may need.
2. What are the 7 steps of forecasting?
The seven basic steps are defining the objective, selecting a forecast period, collecting data, cleaning and analyzing the data, identifying trends, choosing a forecasting method, and reviewing the forecast for accuracy.
3. What is the best method of forecasting?
The best forecasting method depends on your data, products, and business goals. Combining quantitative models with qualitative can provide a more reliable forecast, especially when historical data alone does not capture market changes.
















.png)