




Inventory management KPI refers to measurable indicators businesses use to evaluate how effectively they manage, store, move, and sell inventory. These metrics turn inventory data into actionable insights to help understand business performance.
For Philippine businesses with multiple warehouses, tracking inventory KPIs replaces error-prone manual tasks to quickly spot slow-moving stock and record discrepancies. Learn how to optimize your warehouse management KPIs efficiently below.
 Key Takeaways
- Inventory management KPIs are measurable indicators that help businesses evaluate inventory performance, costs, warehouse operations, and customer service.
- Tracking the right inventory KPIs can help businesses improve stock control, reduce inventory costs, increase inventory accuracy, and make better demand forecasts.
- Inventory KPIs can be grouped into five categories which are financial, receiving, customer satisfaction, operational, and labor KPIs.
- ScaleOcean Atlas can automate inventory KPI tracking by centralizing inventory data, monitoring stock, and providing real-time insights to support efficient inventory management.
What is KPI in Inventory Management?
KPI stands for Key Performance Indicator, in inventory management, a KPI is a measurable value that shows how well a particular inventory-related activity is performing against a business objective.
The right KPIs depend on the company’s industry, size, sales model, and operational goals. A grocery retailer in Metro Manila may prioritize stockout rate and sell-through, while a manufacturing company in Laguna may focus more heavily on inventory accuracy.
What are the Benefits of Proper KPIs in Inventory?
Choosing and monitoring the right inventory KPIs can help businesses make better decisions instead of simply reacting to inventory problems. Below here are some benefits of proper KPIs for inventory management which include:
- Better stock control: The ability as inventory tracking which function to identify excess inventory, low-stock items, and products that are not moving.
- Lower inventory costs: Monitor holding costs, storage expenses, and other costs associated with excess stock.
- Improved cash flow: Reduce capital tied up in products that take too long to sell.
- Higher inventory accuracy: Compare recorded inventory with actual stock levels.
- Better warehouse efficiency: Identify delays in receiving, putaway, picking, and fulfillment.
- Better forecasting: Compare projected demand with actual sales to improve future planning.
KPI tracking isn’t just routine, it is a must. A research in the journal Ani: Letran Calamba Research Report Calamba found that poor forecasting could result in excessive inventory and products remaining that damaged the products. This shows why tracking the right KPIs from the start matters just as much as choosing them.
The Types of Inventory KPIs
There are various types of inventory KPIs, and they may be divided into various categories depending on what they measure. There are financial, receiving, customer satisfaction, operational, and labour inventory KPIs. These are easier to group together for businesses to select the metrics that are relevant to their objectives, categories include:
- Financial inventory KPIs: Inventory Turnover Ratio, Days Sales of Inventory (DSI), Weeks on Hand, Stock to Sales Ratio, Sell-in Rate, Sell-Out Rate, Cost of Goods Sold (COGS), Cost per Unit, Revenue per Unit, Gross Margin per Unit, Return on Investment (ROI), and Gross Margin Return on Investment (GMROI).
- Receiving inventory KPIs: Time to Receive, Putaway Time, Supplier Quality Index, and Order Accuracy Rate.
- Customer satisfaction inventory KPIs: Stockout Rate, Backorder Rate, Order Fill Rate, Perfect Order Rate, Lead Time, Customer Satisfaction Score (CSAT), and Service Level.
- Operational inventory KPIs: Order Fill Rate, Cycle Time, Inventory Shrinkage, Aging Inventory, Dead Stock, Holding Costs, Inventory Accuracy, and Demand Forecasting Accuracy.
- Labor inventory KPIs: Labor Cost per Item and Labor Cost per Hour.
Those are some crucial inventory management KPIs for businesses to assess performance in these areas. Each category of KPI is discussed in the following section, enabling you to understand and apply it successfully to improve warehouse performance.

12 Financial Inventory KPIs
By measuring financial inventory KPIs, businesses can gain insight into the impact of inventory on revenue, costs, profitability, and working capital. Here are some of the Key Performance Indicators (KPIs) to measure financial in inventory management:
1. Inventory Turnover Ratio
The inventory turnover ratio is the number of times that a business turns over its average inventory over a given time period. The greater the ratio, the faster goods flow through the inventory. But, a very high ratio may mean that the amount of stock is too low:
Inventory Turnover = Cost of Goods Sold / Average Inventory
2. Days Sales of Inventory (DSI) / Days on Hand (DOH)
Days on Hand (DSI) is an estimation of the number of days that the inventory on hand will cover the current sales rate. If the DSI is lower it is likely that sales are occurring at a higher rate without necessarily affecting the industry’s goals. The formula of DSI is:
DSI = (Average Inventory / COGS) × Number of Days
3. Weeks on Hand
This inventory management KPI is when the number of weeks that the stock’s value is expected to last before it is used up. For Philippine retailers and distributors that run on inventory based on weekly sales, this KPI may be helpful. The formula is made up of:
Weeks on Hand = Inventory on Hand / Average Weekly Demand
4. Stock to Sales Ratio
Additionally, the Stock to Sales Ratio is the number of stocks on hand or their value compared to the sales value or number for a specific time. This indicator can be used to determine if a business has too much or too little inventory based on sales. Here’s the formula:
Stock to Sales Ratio = Inventory / Sales
5. Sell-in Rate
Sell-in Rate is the volume of merchandise sold by a manufacturer or distributor to a retailer or other business customer over a given time period. It can give suppliers an idea about the speed at which products are making their way to downstream sales.
Sell-in Rate = Units Sold to Retailers or Distributors / Total Units Available × 100
6. Sell-Out Rate / Sell-Through Ratio
Sell-out measures how quickly products are sold to the end customer. A sell-through rate is often cited as a percentage of the available stock that is sold. This KPI is especially helpful for those who deal in products, such as retail, that experience rapid fluctuations in demand.
Sell-Through Rate = Units Sold / Units Available × 100
7. Cost of Goods Sold (COGS)
In addition, the direct cost that is incurred on products sold in a specific time period is called COGS. Inventory management KPI of COGS helps businesses to understand how much inventory cost is being turned into sales. Below here are the formula:
COGS = Beginning Inventory + Purchases – Ending Inventory
8. Cost per Unit
Cost per Unit is to measure the average cost of producing or buying an inventory unit. By keeping an eye on this metric, businesses can track supplier prices, production costs, freight costs, or any other costs associated with inventory. Which the formula is:
Cost per Unit = Total Inventory Cost / Number of Units
9. Revenue per Unit
Revenue per Unit is the amount of revenue that is collected for each unit sold. Businesses can use this metric to better determine the profitability of each unit when comparing it with Cost per Unit. The formula for Revenue Per Unit is given as:
Revenue per Unit = Total Revenue / Units Sold
10. Gross Margin per Unit
Gross Margin per Unit is the profit or margin per sale after the cost of the product. This aids businesses to understand which products would be more profitable. The formula consist of:
Gross Margin per Unit = Selling Price per Unit – Cost per Unit
11. Return on Investment (ROI)
Another KPI that is commonly used is ROI or Return on Investment. This KPI is the ratio of return earned to the investment amount. ROI is a useful metric for inventory because it can be used to determine if the company is getting a good return on its investment in inventory.
ROI = (Return – Investment Cost) / Investment Cost × 100
12. Gross Margin Return on Investment (GMROI)
GMROI is an indicator that shows the gross margin a company makes per peso of inventory invested. The higher the GMROI, the more profitable the stock is. The formula is:
GMROI = Gross Margin / Average Inventory Cost
4 Receiving Inventory KPIs

Receiving is one of the first points where inventory enters a warehouse. Delays or errors during receiving can affect stock availability throughout the rest of the operation. Here are some of the KPIs in receiving inventory process:
1. Time to Receive
Time to Receive measures how long it takes to receive and process incoming inventory after it arrives at the warehouse. A shorter receiving time can help inventory become available for sale or production sooner. Here is the formula used for this KPI:
Time to Receive = Receiving Completion Time – Inventory Arrival Time
2. Putaway Time
Putaway Time measures how long it takes to move received inventory from the receiving area to its assigned storage location. Long putaway times can create warehouse congestion and delay inventory availability. The formula of Putaway Time:
Putaway Time = Putaway Completion Time – Receiving Completion Time
3. Supplier Quality Index
Supplier Quality Index evaluates the quality and consistency of inventory received from suppliers. Businesses can consider factors such as defective units, damaged products, rejected shipments, and quality-related returns. The formula is:
Supplier Quality Index = (Accepted Units / Total Units Received) × 100
4. Order Accuracy Rate
Order Accuracy Rate measures how often incoming shipments match the purchase order. A high rate indicates that suppliers are consistently delivering the correct products and quantities.
Order Accuracy Rate = Accurate Orders / Total Orders × 100
7 Customer Satisfaction Inventory KPIs
Inventory problems can quickly become customer problems. If a product is unavailable, delivered late, or only partially fulfilled, customer satisfaction may decline. This section will explain the KPIs to evaluate customer satisfaction:
1. Stockout Rate
Stockout Rate measures how frequently requested products are unavailable when customers need them. A high stockout rate can indicate inaccurate forecasting, insufficient safety stock, or supplier delays. Here’s the formula of stockout rate:
Stockout Rate = Stockout Events / Total Demand Events × 100
2. Backorder Rate
Backorder Rate measures the percentage of customer orders that cannot be fulfilled immediately because inventory is unavailable. A lower backorder rate generally indicates better product availability. The formula is:
Backorder Rate = Backordered Orders / Total Orders × 100
3. Order Fill Rate
Order Fill Rate measures the percentage of customer demand fulfilled from available inventory. A strong fill rate means customers are more likely to receive what they ordered without waiting for additional stock.
Order Fill Rate = Units Fulfilled / Units Ordered × 100
4. Perfect Order Rate
Perfect Order Rate measures the percentage of orders completed without errors, such as incorrect products, missing items, damaged goods, or late deliveries. This KPI provides a broader view of fulfillment quality than simply measuring whether an order was shipped.
Perfect Order Rate = Perfect Orders / Total Orders × 100
5. Lead Time
Inventory Lead Time measures the time between placing an order and receiving the inventory. For Philippine businesses that source products internationally, lead time can be affected by supplier schedules, customs processing, shipping, port activity, and local transportation.
Lead Time = Inventory Receipt Date/Time – Order Placement Date/Time
6. Customer Satisfaction Score (CSAT)
Another important KPI is CSAT, which measures how satisfied customers are with their experience. Although it is not an inventory metric by itself, CSAT can help businesses determine whether inventory availability and fulfillment performance are affecting customer experience.
CSAT = Satisfied Responses / Total Survey Responses × 100
7. Service Level
Service Level measures the ability of a business to meet customer demand without running out of inventory. A high service level generally means customers can obtain products when they need them. The formula of service level is:
Service Level = Demand Fulfilled Without Stockout / Total Demand × 100
8 Operational Inventory KPIs
Operational inventory KPIs focus on the day-to-day efficiency and health of inventory management. Therefore, the KPIs help evaluate operational management of inventory processes. Here are the description and the formula of operational inventory KPIs:
1. Order Fill Rate
Order Fill Rate can also be used as an operational KPI because it measures how effectively available inventory supports order fulfillment. Monitoring it across warehouses, branches, product categories, or sales channels can reveal where fulfillment problems are occurring.
Order Fill Rate = Units Fulfilled / Units Ordered × 100
2. Cycle Time
Inventory Cycle Time measures the time required to complete a particular inventory process, such as receiving, picking, packing, or fulfillment. Reducing unnecessary cycle time can improve warehouse productivity. The formula is:
Cycle Time = Process Completion Time – Process Start Time
3. Inventory Shrinkage
The third KPI of inventory management for operational inventory is Inventory Shrinkage. This KPI is the difference between recorded inventory and the actual physical inventory available. Below here is the formula of Inventory Shrinkage to evaluate operational management:
Inventory Shrinkage = Recorded Inventory – Actual Inventory
4. Aging Inventory
In addition, Aging Inventory measures how long products have remained in stock. Businesses can establish aging categories such as 30 or 180 days depending on the product lifecycle. It’s important for products that can expire or lose market value.
Inventory Age = Current Date – Inventory Receipt Date
5. Dead Stock
The fifth KPI is dead stock, which refers to inventory that has little or no sales activity for an extended period. Tracking dead stock helps businesses identify products that may require promotions, liquidation, supplier returns, or purchasing adjustments.
Dead Stock Rate = Dead Stock Units / Total Inventory Units × 100
6. Holding Costs
Holding costs represent the expenses associated with storing inventory. These can include warehouse space, insurance, handling, utilities, and security which determine whether maintaining additional inventory is financially worthwhile. The formula:
Inventory Holding Cost = Storage Costs + Insurance + Handling + Utilities + Obsolescence + Other Inventory Costs
Businesses can also calculate the holding cost rate:
Holding Cost Rate = Annual Holding Costs / Average Inventory Value × 100
7. Inventory Accuracy
Next, when evaluating operational inventory, it’s best to determine the inventory accuracy. This is to measure how closely system records match the actual quantity physically available. The formula of KPI inventory accuracy is:
Inventory Accuracy = Correct Inventory Records / Total Inventory Records × 100
8. Demand Forecasting Accuracy
Additionally, Demand Forecasting Accuracy is also important to be evaluated as KPI in operational inventory. A more accurate forecast helps businesses determine appropriate reorder quantities and safety stock levels. The formula is:
One simple method is to calculate the forecast error first:
Forecast Error = Actual Demand – Forecasted Demand
Then calculate accuracy:
Forecast Accuracy = (1 – (Actual Demand – Forecasted Demand) / Actual Demand) × 100
2 Labor Inventory KPIs
Another inventory management KPI also depends heavily on warehouse and logistics employees. Labor KPIs help managers understand how efficiently employees are handling inventory-related activities. Below here’s the KPIs that categorized for labor inventory:
1. Labor Cost per Item
Labor Cost per Item measures the amount of labor expense associated with processing each inventory item. This metric can help businesses compare productivity across warehouses, shifts, or processes. The formula is:
Labor Cost per Item = Total Inventory Labor Cost / Items Processed
2. Labor Cost per Hour
Labor cost per hour measures the amount spent on inventory-related labor for each working hour. Tracking this KPI alongside productivity metrics provides more context than looking at labor expenses alone. The formula is consist of:
Labor Cost per Hour = Total Labor Cost / Total Labor Hours
Factors to Consider before Determining Your KPIs
Not every business needs to track every inventory KPI. Monitoring too many metrics can create unnecessary complexity and make it harder to identify the numbers that actually matter. Before selecting your KPIs, consider the following:
- Business Objectives: Start with the business outcome you want to improve. For example, if your goal is to reduce excess inventory, focus on metrics such as DSI, Weeks on Hand, inventory turnover, aging inventory, and holding costs.
- Industry: Inventory requirements differ between industries. A pharmaceutical business may prioritize expiry and inventory accuracy, while a fashion retailer may focus more on sell-through, stockouts, and dead stock.
- Product Characteristics: Consider factors such as product shelf life, value, size, demand volatility, and seasonality. Perishable products, for instance, may require more frequent monitoring than durable products.
- Warehouse Structure: If your business operates several warehouses or branches across the Philippines, consider tracking KPIs separately by location. This can help identify whether one warehouse has higher shrinkage or lower inventory accuracy than another.
- Data Availability: A KPI is only useful when the underlying data is accurate and consistently updated. Before creating a metric, make sure your business can reliably collect the information needed to calculate it. Using software to track inventory KPIs can also help centralize inventory data and make it easier to monitor KPI performance accurately.
How Do You Accurately Track Inventory Management KPIs?
Accurate KPI tracking starts with reliable inventory data, often verified through a routine inventory audit. If inventory records are outdated or inconsistent, even a sophisticated KPI dashboard can produce misleading results. To track inventory KPIs effectively, businesses can follow these steps:
- Define the Objective: Decide what business problem the KPI should address, such as reducing stockouts, lowering holding costs, or improving inventory accuracy.
- Choose Relevant Metrics: Select KPIs that directly support your business goals instead of tracking metrics that do not provide useful insights.
- Standardize Formulas: Use consistent formulas and measurement methods so different teams or locations calculate each KPI in the same way.
- Centralize Inventory Data: Connect purchasing, receiving, sales, warehouse, and stock movement information to create a more complete view of inventory performance.
- Update Data Regularly: Use real-time or frequent inventory updates so managers can identify issues and respond before they affect operations.
- Compare Performance With Targets: Set benchmarks or targets for each KPI to determine whether inventory performance is meeting expectations.
- Track Trends Over Time: Review KPI results regularly instead of looking at a single month’s performance. This can help identify recurring patterns and long-term changes.
- Analyze by Location or Product: Break down KPI results by warehouse, branch, product, or sales channel to identify where inventory problems are occurring.
- Take Corrective Action: Use KPI results to improve purchasing, replenishment, warehouse processes, supplier management, or other inventory activities.
For Philippine businesses, this approach can also support more organized inventory recordkeeping. Under Section 6(C) of the National Internal Revenue Code, the BIR Commissioner has the authority to order inventory-taking of a taxpayer’s goods at any time during the taxable year, making accurate, audit-ready inventory records a compliance matter as well as an operational one.
ScaleOcean Atlas Automates Inventory KPI Tracking for You
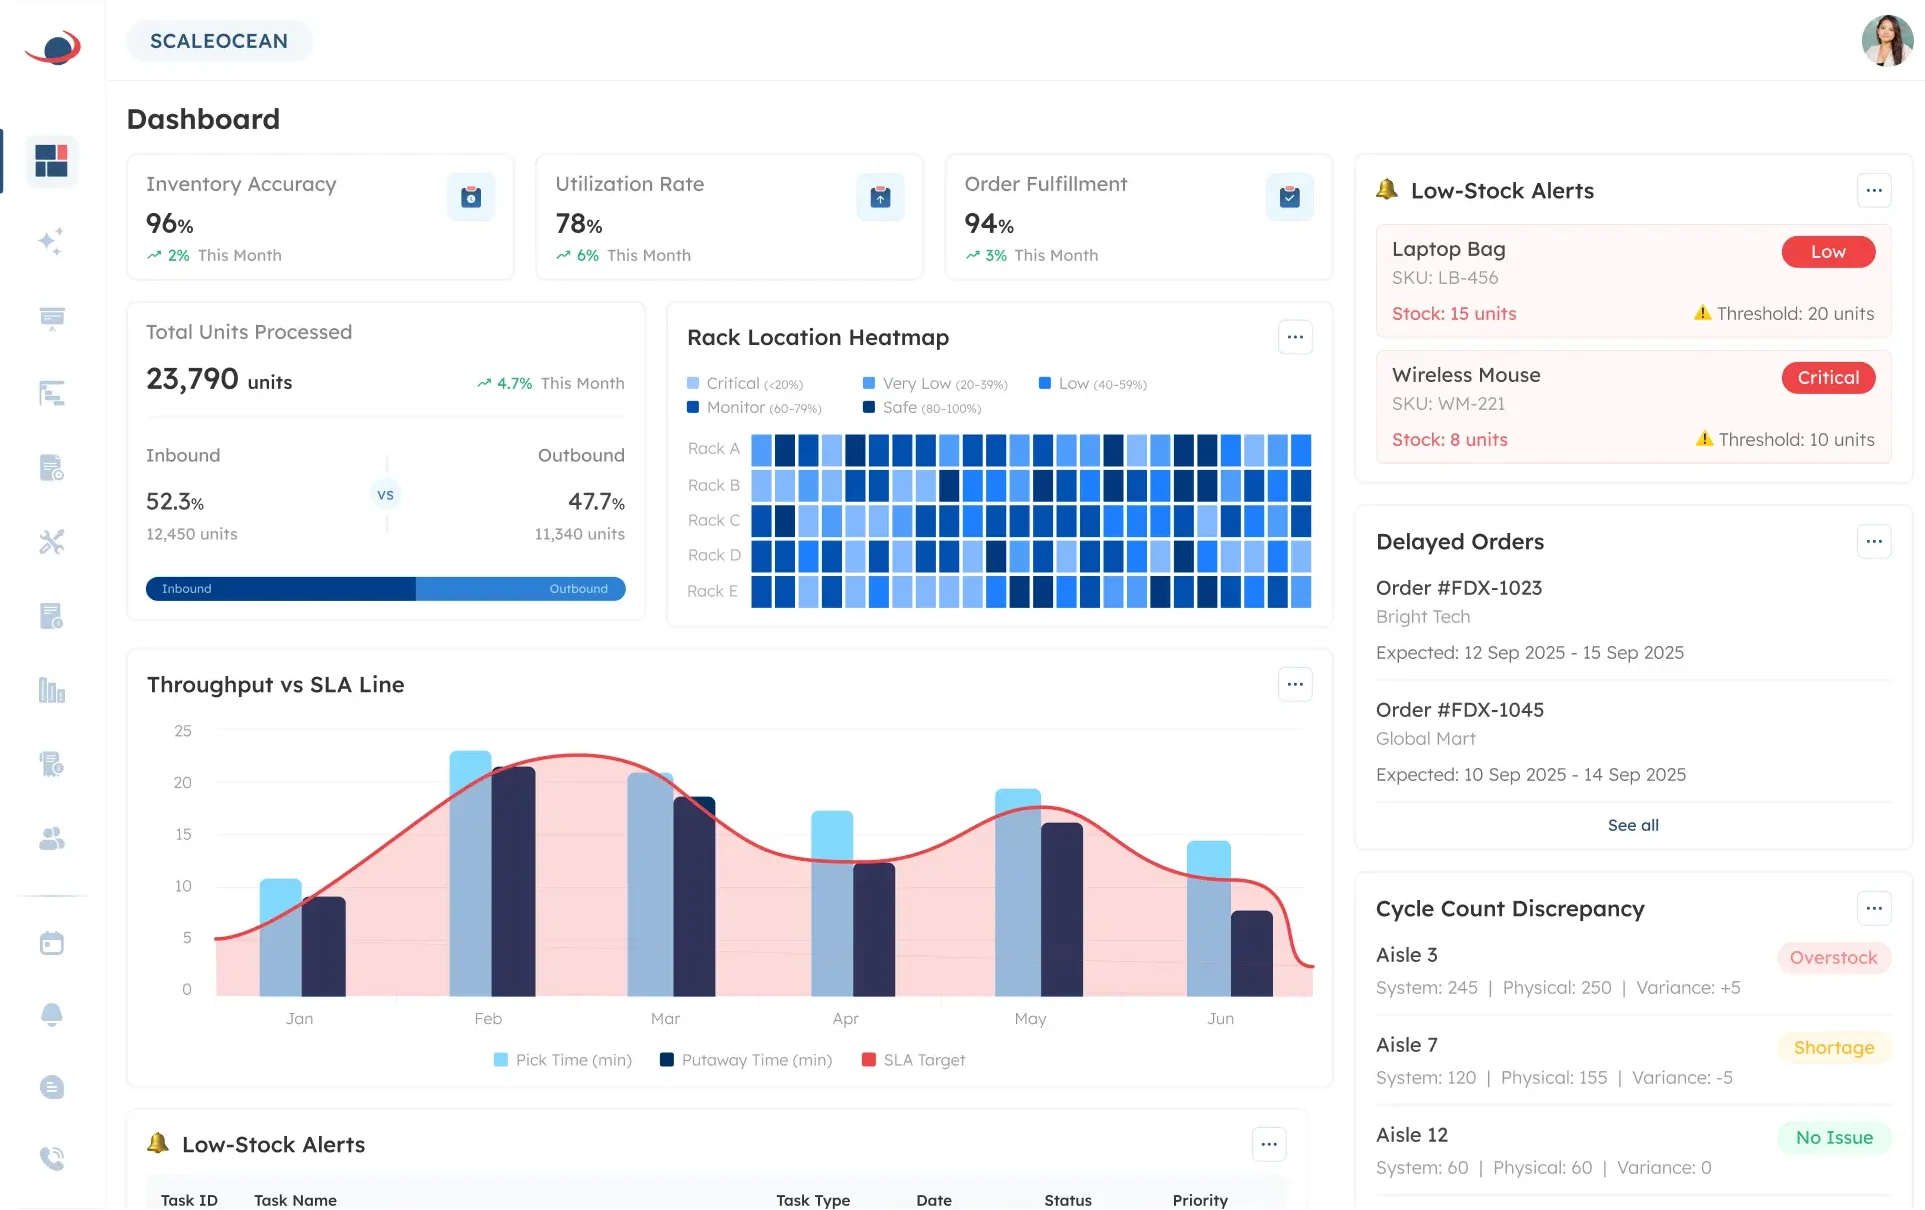
With operations spread across various warehouses, channels, and suppliers, keeping track of inventory KPIs manually becomes a hassle. Managing multiple spreadsheets is time-consuming and also can lead to discrepancies in stocks.
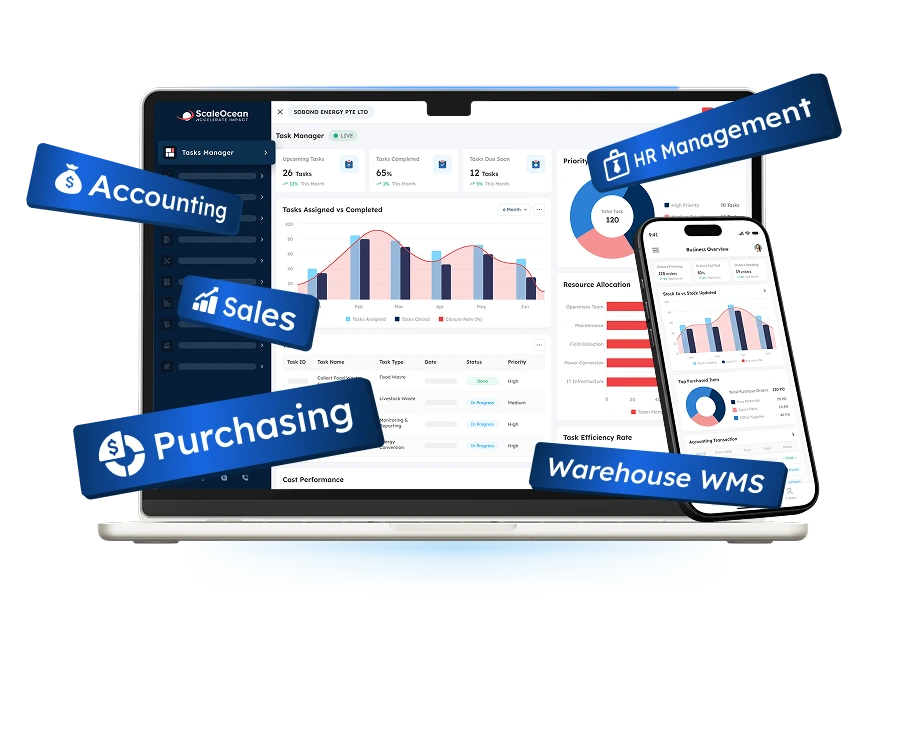
Therefore, the inventory module of ScaleOcean Atlas eliminates the friction by centralizing your entire inventory ecosystem into a single, automated platform. Powered with ScaleMind, an integrated AI assistant, the software analyzes stock movements, flags anomalies, and delivers clear actionable insights for smarter demand planning.
Book a consultation today to transform how you track inventory performance and scale your business operations. You’d have access to features such as:
- Real-Time Inventory Tracking: Keep track of inventory levels as they change with the purchase, sale, return, transfer or any other movement of inventory, providing companies with more visibility of the stocks currently on hand.
- Inventory KPI Monitoring: Monitor key inventory KPIs like inventory accuracy, stock levels, inventory turnover, and more using centralized inventory data.
- Integrated Procurement & Accounting: Link all functions of purchasing, inventory, sales and accounting together in a single platform, and manage inventory costs and Cost of Goods Sold (COGS).
- Barcode and RFID Integration: Use barcode scanning and RFID technology to record inventory movements more efficiently and reduce the risk of manual recording errors.
- Batch & Lot Traceability:Trace products by batch or lot to enhance product inventories, stock rotation, and monitoring products with specific expiration dates.
- AI-Powered Inventory Insights: Use ScaleMind to gain insights into inventory trends, detect abnormal stock movements, and inform more effective replenishment and inventory planning.
In Conclusion
Inventory management KPIs reveal the effectiveness of your business in managing inventory, improving your operations, and meeting customer expectations. Businesses keep track of metrics such as inventory turns, days on hand, sell-through, and stockouts, rather than simply counting inventory.
Accurate inventory knowledge is essential to the business not just for everyday operations, but additionally for the financial reporting and tax compliance of the company. An integrated system allows you to have all your data in one place, allowing it to be tracked easily and seamlessly.
Streamline your inventory management and KPI tracking with the inventory module of ScaleOcean Atlas. Gain real-time visibility into inventory performance and make faster, data-driven decisions to improve operational efficiency.
Book a consultation with our team today to discuss your business needs with our experts.
FAQ:
1. What is a good KPI for inventory management?
One of the most helpful inventory KPIs is its turnover ratio. It reflects the velocity of a business’s sales and restocking. A high ratio may suggest that the company is having good sales, whereas a low ratio may suggest that the company is having slow moving or excess inventory.
2. What are the three key measures of inventory?
Three common inventory measures are inventory turnover, Days Sales of Inventory (DSI), and inventory carrying cost. They show how quickly stock sells, how long inventory remains unsold, and how much it costs to store and maintain inventory.
3. How do I manage my inventory?
Keep stock levels under control, monitor stock regularly, determine reorder levels, and carry out regular physical stock counts. Inventory software may additionally accurately track sales, purchase, returns and inventory movements.
















.png)